Best Business Intelligence Tools
The best business intelligence tools are Microsoft Power BI, SAS Business Intelligence, Google Data Studio, and QlikSense. Such business intelligence software help turn data into insightful Information through careful processing and analysis.


No Cost Personal Advisor
List of 20 Best Business Intelligence Tools
Contenders | 2024
Domo puts data to work for everyone
DOMO helps by smarter and faster decision maker for the marketing. It will find out suitable the hidden opportunity and data for the business. DOMO is the center strategic discussions and provides real-time data to clearly demonstrate the marketing contribution. Read DOMO Reviews
Explore various DOMO features, compare the pricing plans, and unlock the potential of seamless operations by selecting the right software for your business.
Features
View all DOMO Features- Single Sign On
- Dashboard
- Ad hoc Analysis
- Data Visualization
- Event Triggered Actions
- For Mobile
- Machine Learning
- Scorecarding
Pricing
DOMO Caters to
- StartUps
- SMBs
- Agencies
- Enterprises
Tools by GrapeCity
GrapeCity Documents is a fully featured Document Management Software designed to serve SMEs, Enterprises. GrapeCity Documents provides end-to-end solutions designed for Macintosh. This online Document Management system offers Document Assembly at one place. Learn more about GrapeCity
Explore various GrapeCity features, compare the pricing plans, and unlock the potential of seamless operations by selecting the right software for your business.
Features
View all GrapeCity Features- Search Option
- Document Assembly
- Document Indexing
- Document Conversion
- Document Storage
GrapeCity Caters to
- StartUps
- SMBs
- Agencies
- Enterprises
Contenders | 2024
Transform raw business data to refined insights.
Zoho Analytics is a BI and analytics solution that allows you to create insightful reports and dashboards. It assists you to visually analyze your business data and to take informed decisions. Read Zoho Analytics Reviews
Explore various Zoho Analytics features, compare the pricing plans, and unlock the potential of seamless operations by selecting the right software for your business.
Features
View all Zoho Analytics Features- Report writers
- Ad hoc Query
- Performance Metrics
- Data Blending
- KPIs
- Performance Management
- Data Cleansing
- Data Integration
Pricing
Zoho Analytics Caters to
- StartUps
- SMBs
- Agencies
- Enterprises
Tools by Jungle Scout
Jungle Scout is a fully featured Ecommerce software designed to serve SMEs, Startup, Agencies, Enterprises. Jungle Scout provides end-to-end solutions designed for Web App. This Ecommerce software offers Dashboard, Customer Management, Affiliate Marketing, Compliance Management, Contact Management at one place. Learn more about Jungle Scout
Explore various Jungle Scout features, compare the pricing plans, and unlock the potential of seamless operations by selecting the right software for your business.
Features
View all Jungle Scout Features- Campaign Management
- Continuous Deployment
- Dashboard
- Compliance Management
- Analytics
- Affiliate Marketing
- Approval Workflow
- Billing & Invoicing
Pricing
Jungle Scout Caters to
- StartUps
- SMBs
- Agencies
- Enterprises
Emergents | 2024
Empower all types of users to access and process d
Oracle Analytics Cloud is a cloud native platform that offers a complete solution with embedded machine learning that delivers insights for all data to business users, data engineers and data scientists. Learn more about Oracle Analytics Cloud
Explore various Oracle Analytics Cloud features, compare the pricing plans, and unlock the potential of seamless operations by selecting the right software for your business.
- Data Analysis
- Online Analytical Processing (OLAP)
- OLAP
- Ad hoc Analysis
- Data Classification
- Data Mining
- Machine Learning
- Data Matching
Oracle Analytics Cloud Caters to
- StartUps
- SMBs
- Agencies
- Enterprises
Contenders | 2024
Popular BI tools
Power BI - business intelligence tool is a suite of business analytics tools that deliver insights throughout your organization. Connect to hundreds of data sources, simplify data prep, and drive ad hoc analysis. Read Power BI Software Partner Reviews
Explore various Power BI Software Partner features, compare the pricing plans, and unlock the potential of seamless operations by selecting the right software for your business.
- Strategic Planning
- Ad hoc Analysis
- Data Analysis
- Data Mining
- Data Quality management
- Trend / Problem Indicators
- Key Performance Indicators
- Ad hoc Query
Pricing
Regular
$ 10
User/Month
Power BI Software Partner Caters to
- StartUps
- SMBs
- Agencies
- Enterprises
Contenders | 2024
A top business intelligence software
Microsoft Power BI is a suite of Business Intelligence tools that work together to convert a myriad of data into actionable insights. Your data could be on the cloud, in your company’s server, or a hybrid environment. Power BI can turn these unrelated data sources into visual reports for a centralized database. Read Microsoft Power BI Reviews
Explore various Microsoft Power BI features, compare the pricing plans, and unlock the potential of seamless operations by selecting the right software for your business.
Microsoft Power BI Caters to
- StartUps
- SMBs
- Agencies
- Enterprises
Emergents | 2024
Cloud Based Accounting and Compliance Software
Use IDOS Add-in to create the business record for sales, purchase and other analytics from IDOS Accounting & Compliance software with real-time resolution making reports into Microsoft Excel Online. Read IDOS Reviews
Explore various IDOS features, compare the pricing plans, and unlock the potential of seamless operations by selecting the right software for your business.
IDOS Caters to
- StartUps
- SMBs
- Agencies
- Enterprises
Emergents | 2024
Big Analytical data made easy with this BI tool.
Ideata Analytics is a combined business intelligence platform so helps provide and explain data at scale. convert and visualize data with Ideata to help business view insights like never before. Read Ideata Analytics Reviews
Explore various Ideata Analytics features, compare the pricing plans, and unlock the potential of seamless operations by selecting the right software for your business.
Ideata Analytics Caters to
- StartUps
- SMBs
- Agencies
- Enterprises
Emergents | 2024
The easiest way to get real business insights
Sisense is a Simplifying business intelligence for complex data easily it has prepared and analyzes both big and disparate datasets. Sisense gives business a simple way to manage analyze and visualize all data. Read Sisense Reviews
Explore various Sisense features, compare the pricing plans, and unlock the potential of seamless operations by selecting the right software for your business.
Features
View all Sisense Features- Ad hoc Query
- Visualization / Presentation
- transform and load (ETL)
- Data Visualization
- Ad Hoc Reports
- Ad hoc Analysis
- Dashboard
- Scorecarding
Sisense Caters to
- StartUps
- SMBs
- Agencies
- Enterprises
Emergents | 2024
Simplified Tableau Documentation
Doxami is a simplified Tableau documentation tool which let your team focus on the Visualization rather than getting sidetracked by the Tableau documentation. It is a very simple yet powerful tool that is ideal for making Tableau Documentation within just a few clicks. Read Doxami Reviews
Explore various Doxami features, compare the pricing plans, and unlock the potential of seamless operations by selecting the right software for your business.
Features
View all Doxami Features- Online Analytical Processing (OLAP)
- Ad hoc Analysis
- Report writers
- Ad Hoc Reports
- Visualization / Presentation
Pricing
Single User
$ 179
Per Year
Single Workbook
$ 5
Per Workbook
Enterprise
$ 0
As per plan
Doxami Caters to
- StartUps
- SMBs
- Agencies
- Enterprises
Contenders | 2024
Tools by Databox, Inc
Databox is a very easy, flexible and user-friendly business intelligence software solution. That is first of KPI dashboards for business. It is based on goals or connection with any of them straightforwardly to get help one-on-one. Read Databox Reviews
Explore various Databox features, compare the pricing plans, and unlock the potential of seamless operations by selecting the right software for your business.
Features
View all Databox Features- Data Visualization
- Profitability Analysis
- Key Performance Indicators
- Ad hoc Analysis
- Performance Metrics
- Data Mining
- Budgeting & Forecasting
- Strategic Planning
Pricing
Free
$ 0
Per Month
Basic
$ 59
Per Month
Business
$ 299
Per Month
Databox Caters to
- StartUps
- SMBs
- Agencies
- Enterprises
Emergents | 2024
Better Insights = Better Decisions
Vivid Reports is a fully featured Business Intelligence Software designed to serve Agencies, Enterprises. Vivid Reports provides end-to-end solutions designed for Windows. This online Business Intelligence system offers Data Analysis, Benchmarking, Audit Trail, Income Statements, Performance Metrics at one place. Learn more about Vivid Reports
Explore various Vivid Reports features, compare the pricing plans, and unlock the potential of seamless operations by selecting the right software for your business.
Features
View all Vivid Reports Features- Consolidation / Roll-Up
- Balance Sheet
- Data warehousing
- Profit / Loss Statement
- Benchmarking
- Predictive Analytics
- Version Control
- Data Analysis
Vivid Reports Caters to
- StartUps
- SMBs
- Agencies
- Enterprises
Emergents | 2024
Tools by Oracle Corporation
Oracle Business Intelligence is a fully featured Business Intelligence Software designed to serve Startups, Agencies. Oracle Business Intelligence provides end-to-end solutions designed for Windows. This online Business Intelligence system offers Predictive Analytics, Data Analysis, Dashboard, Ad hoc Query, Ad Hoc Reports at one place. Learn more about Oracle BI
Explore various Oracle BI features, compare the pricing plans, and unlock the potential of seamless operations by selecting the right software for your business.
Features
View all Oracle BI Features- Ad hoc Analysis
- Dashboard
- Data Analysis
- Predictive Analytics
- Ad hoc Query
- Ad Hoc Reports
- Profitability Analysis
Oracle BI Caters to
- StartUps
- SMBs
- Agencies
- Enterprises
Emergents | 2024
Our BI software Connects people with information.
BI/MIS Business intelligence tool is a standard of application software produce to retrieve, transform, analyze and report data for business intelligence. SmartDrive Labs is separate by its story of unsurpassed technology expertise its great track report of delivery and its experienced, enthusiastic people. Read SmartDrive-BI/MIS System Reviews
Explore various SmartDrive-BI/MIS System features, compare the pricing plans, and unlock the potential of seamless operations by selecting the right software for your business.
SmartDrive-BI/MIS System Caters to
- StartUps
- SMBs
- Agencies
- Enterprises
Emergents | 2024
Tools by Easy Insight
Easy Insight is an affordable, intuitive solution for business intelligence. Simply and easily set-up, no need for extra installation. SaaS reporting gives enhanced visibility from files or relevant database. Improve the database by filtering non-relevant data and duplications. Learn more about Easy Insight
Explore various Easy Insight features, compare the pricing plans, and unlock the potential of seamless operations by selecting the right software for your business.
Features
View all Easy Insight Features- Profitability Analysis
- Performance Management
- Scorecarding
- Online Analytical Processing (OLAP)
- Performance Metrics
- Data Analysis
- Data Mining
- Data Visualization
Pricing
Basic
$ 50
Per Month
Easy Insight Caters to
- StartUps
- SMBs
- Agencies
- Enterprises
Contenders | 2024
Tools by SAP
SAP BusinessObjects is a fully featured Business Intelligence Software designed to serve SMEs, Agencies. SAP BusinessObjects provides end-to-end solutions designed for Windows. This online Business Intelligence system offers Performance Metrics, Data Analysis, Budgeting & Forecasting, Ad Hoc Reports, Ad hoc Query at one place. Read SAP BusinessObjects Reviews
Explore various SAP BusinessObjects features, compare the pricing plans, and unlock the potential of seamless operations by selecting the right software for your business.
- Ad Hoc Reports
- Dashboard
- Ad hoc Query
- Budgeting & Forecasting
- Performance Metrics
- Strategic Planning
- Data Analysis
- Benchmarking
SAP BusinessObjects Caters to
- StartUps
- SMBs
- Agencies
- Enterprises
Emergents | 2024
Tools by Dundas Data Visualization, Inc
Dundas BI is a business intelligence tool for the medium to enterprise organizations.It is a fully customized solution. Seamlessly integrates with a smart application. It gives real-time data and information across the organization. Read Dundas BI Reviews
Explore various Dundas BI features, compare the pricing plans, and unlock the potential of seamless operations by selecting the right software for your business.
Features
View all Dundas BI Features- Ad hoc Query
- Dashboard
- Relational Display
- Ad Hoc Reports
- Analytics
- Content Management System
- Predictive Analytics
- Filtered Views
Dundas BI Caters to
- StartUps
- SMBs
- Agencies
- Enterprises
Emergents | 2024
Tools by Geckoboard
Geckoboard is power-packed dash software that can create on-demand TV dashboard for your business and help you to track the business activities and team productivity in a detailed manner. The dashboard software can bring all your metrics over a centralized place. Learn more about Geckoboard
Explore various Geckoboard features, compare the pricing plans, and unlock the potential of seamless operations by selecting the right software for your business.
Features
View all Geckoboard Features- Filtered Views
- Widgets
- Data Source Integrations
- Dashboard Creation
- Relational Display
- Analytics
- Visual Analytics
- Visual Discovery
Geckoboard Caters to
- StartUps
- SMBs
- Agencies
- Enterprises
Emergents | 2024
Professional BI Dashboard Software
datapine is the leading software provider in the field of innovative business intelligence, dashboard and reporting tools. Thanks to modern self-service analytics functions and an intuitive user interface, non-technical users can also access professional data analytics. Learn more about datapine
Explore various datapine features, compare the pricing plans, and unlock the potential of seamless operations by selecting the right software for your business.
Features
View all datapine Features- Trend / Problem Indicators
- Scorecards
- Key Performance Indicators
- Templates
- Scorecarding
- ROI Tracking
- Data Source Integrations
- Data Analysis
datapine Caters to
- StartUps
- SMBs
- Agencies
- Enterprises
Get Free Expert Advice

Recent Review
Until 30th Apr 2024

The way businesses gather, analyze, and understand data has undergone a revolution thanks to business intelligence tools. Businesses rely on the insights offered by business intelligence software to make educated decisions, spot trends, and spur growth in today's data-driven corporate environment.
With this software, users can glean important information from massive amounts of data, turning it into useful insights that can inform strategic planning, boost operational effectiveness, and improve overall performance. Business intelligence software has evolved into a crucial resource for organizations in a wide range of industries because of its strong analytical capabilities, data visualization tools, and collaboration features.
What is Business Intelligence Software?
Business intelligence (BI) software refers to a set of tools and applications that are designed to collect, analyze, and present large amounts of data within an organization. It helps businesses make informed decisions by transforming raw data into meaningful insights and actionable information.
BI software typically includes features such as data integration, modeling, visualization, and reporting. It can gather data from various sources, including databases, spreadsheets, and online platforms. The software then processes and organizes the data, allowing users to explore and analyze it in a user-friendly manner.
The main purpose of business intelligence software is to provide a comprehensive view of the organization's performance by generating reports, dashboards, and visualizations. These tools enable users to identify trends, patterns, and relationships within the data, facilitating better decision-making at different levels of the organization.
Additionally, BI software often incorporates advanced analytics capabilities, such as data mining, predictive modeling, and machine learning, to uncover insights that may not be immediately apparent. This helps businesses gain a competitive advantage by identifying opportunities, detecting anomalies, and predicting future trends.
Why do Businesses Need a BI Software?
A process for gathering, evaluating, and reporting data to assist business decisions is known as business intelligence (BI). Future event planning, forecasting, and prediction are further uses for it. Numerous sectors use BI software, including finance, healthcare, manufacturing, telecommunications, and government. Tools for business intelligence can be utilized for a variety of administrative duties.
For instance, it can help managers better understand how their business runs, how it compares to its rivals, and what needs to be done to boost performance. When making crucial decisions like employing new staff or introducing new products or services, they can also make better decisions based on real-time data rather than just intuition or conjecture.
The BI tool provides organizations with comprehensive insights about their businesses through detailed analytics and reporting features that users can access anywhere in the world, anytime. These features help organizations make informed choices regarding how they run their businesses daily. In addition to this, BI platforms also provide organizations with critical insights.
Business intelligence (BI) software is a set of business management solutions used to store data, process it, and display it meaningfully. Businesses use BI software to make better decisions by examining business trends and patterns, identifying areas of improvement, and gaining insight into the future.
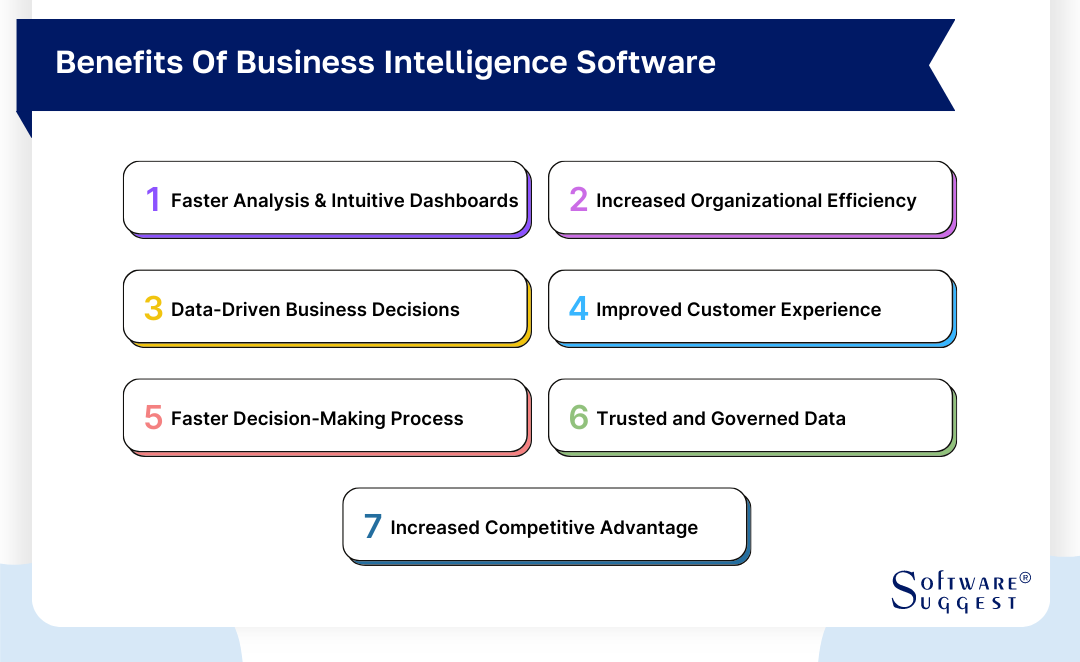
What are the Benefits of Business Intelligence Software?
Business intelligence (BI) is more than just software. It's a holistic initiative to use data in day-to-day operations. The seven benefits of business intelligence solutions below translate into real-world successes showcasing BI in action.
-
Faster Analysis and Intuitive Dashboards
Free and open-source business intelligence software reduces the time needed to analyze by automating repetitive tasks and presenting data in easy-to-understand formats. This eliminates the need for multiple reports and manual calculations so that users can spend less time on data prep and more on analysis. In addition, dashboards are easy to understand, making it easy for non-technical users to participate in the analytics process.
-
Increased Organizational Efficiency
BI systems can help companies become more efficient by providing better access to information across departments and teams. This boosts productivity because people know exactly what they need to do next based on their role in the organization and specific objectives. They no longer have to guess what should come next or ask someone else what they should do because it's all right in front of them!
-
Data-Driven Business Decisions
Business intelligence applications are essential because it help businesses make better-informed choices, leading to tremendous success. The key is having access to the correct information at the right time. If you’re unsure how to use this information, here are some examples -
-
You can identify new opportunities based on trends in your market or industry.
-
You can identify areas where customers might be having problems so that you can fix them before they become serious issues.
-
You can measure the impact of new initiatives so that you know whether or not they’re working before investing more money into them (or canceling them altogether).
-
-
Improved Customer Experience
The data you collect from BI solutions can be used to enhance your customer experience by predicting trends, making recommendations, and automating processes. This will make your customers happier, which will, in turn, improve your brand reputation.
-
Faster Decision-Making Process
Business intelligence system allows companies to make quicker decisions because they can access more data than ever. As a result, they can spot problems earlier and adjust their strategy accordingly before it’s too late. This can result in greater efficiency and lower costs for businesses across the board.
-
Trusted and Governed Data
BI platform enables companies to get more out of their existing data. It facilitates collecting, aggregating, analyzing, and presenting relevant information to support informed decision-making.
This is particularly important for organizations with multiple databases with disparate sources, formats, and structures. With BI, you can consolidate all your data in one place to make it easier to access, use, and understand. You can also combine data from multiple sources — such as internal systems and external websites — to create new insights that would otherwise be impossible to obtain.
-
Increased Competitive Advantage
Businesses use BI tools to improve operational efficiency and gain a competitive advantage over other organizations by better understanding customer needs and behaviors to provide customized products and services.
For example, retailers use BI tools to analyze customer transaction data to improve merchandising strategies by anticipating consumer demand for specific products or deciding which items should be stocked on store shelves based on their popularity with shoppers. The more accurate and timely these predictions are, the more significant the impact on sales revenue is, which ultimately translates into increased profitability.
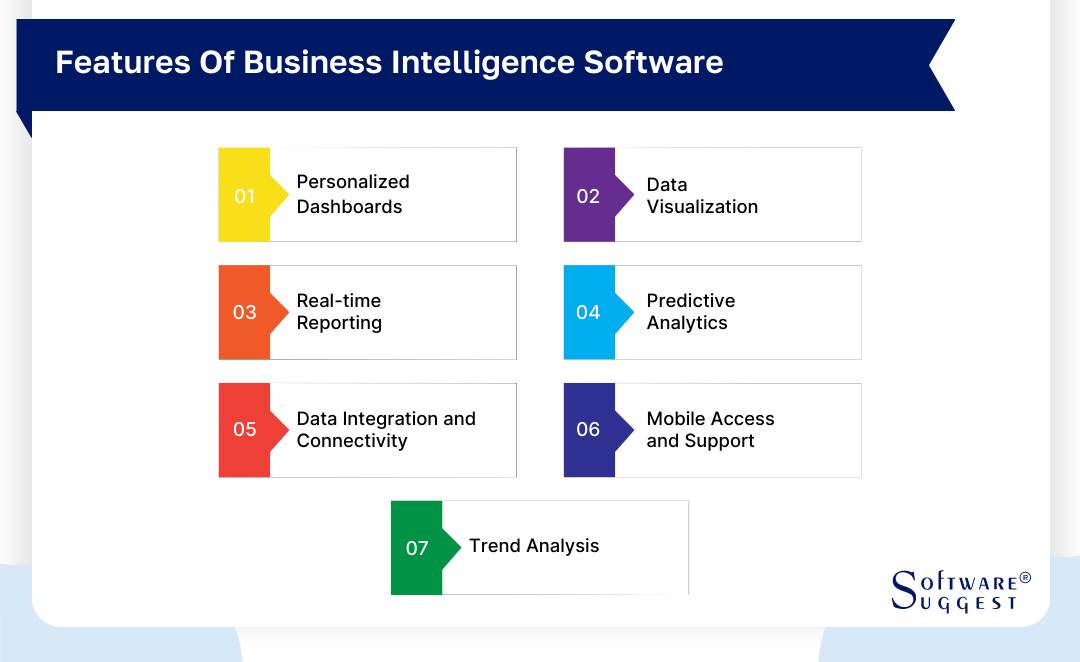
What are the Key Features of Business Intelligence Software?
Business intelligence software offers many features that empower organizations to harness the power of data and make informed decisions. Below are the key features of business intelligence software, and explore how they enhance data-driven decision-making and drive organizational success.
-
Personalized Dashboards
Business intelligence software frequently includes customized dashboards that give users a customizable view of important performance indicators and KPIs. These dashboards allow users to produce data visualizations pertinent to their respective positions and responsibilities. Users can track progress, analyze performance, and acquire insights quickly thanks to customizable dashboards, which compile crucial data into a single, understandable interface.
-
Data Visualization
Data visualization is a powerful feature of business intelligence software that transforms complex data sets into intuitive and visually appealing charts, graphs, and diagrams. By representing data visually, organizations can quickly grasp patterns, trends, and outliers that may not be evident in raw data.
Data visualization tools facilitate effective communication and understanding of data across teams and departments, enabling decision-makers to interpret information more easily and make data-driven decisions.
-
Real-time Reporting
Real-time reporting is a crucial feature that enables organizations to access up-to-the-minute information on their operations, performance, and market dynamics. Business intelligence software allows users to generate reports instantly, eliminating the need for manual data extraction and aggregation. Real-time reporting empowers decision-makers to monitor key metrics in real-time, identify emerging trends, and respond promptly to critical business situations.
-
Predictive Analytics
Predictive analytics is a sophisticated feature that leverages historical data and statistical algorithms to forecast future trends, behaviors, and outcomes. Predictive analytics enables organizations to make proactive decisions and develop effective strategies by analyzing patterns and relationships within data.
Whether it's predicting customer behavior, demand for products, or identifying potential risks, this feature equips businesses with valuable insights to optimize operations and stay ahead of the competition.
-
Data Integration and Connectivity
Business intelligence software offers robust data integration and connectivity capabilities, allowing organizations to gather and consolidate data from multiple sources. Whether it's integrating data from internal systems, external databases, or cloud-based platforms, this feature ensures a comprehensive view of the organization's data ecosystem. By eliminating data silos and enabling seamless data flow, organizations can make holistic analyses and derive accurate insights from diverse data sources.
-
Mobile Access and Support
In today's mobile-centric world, business intelligence software provides mobile access and support, enabling users to access data and insights on the go. With mobile apps or responsive web interfaces, decision-makers can stay connected to critical information, view dashboards, and receive real-time alerts and notifications.
Mobile access ensures that key stakeholders have access to relevant data at any time and from anywhere, facilitating timely decision-making and enhancing productivity.
-
Trend Analysis
Trend analysis is a vital feature of business intelligence software that helps organizations identify patterns and patterns over time. By analyzing historical data, this feature enables businesses to recognize long-term trends, seasonal fluctuations, and emerging patterns that may impact their operations and strategies.
Trend analysis facilitates forecasting, resource allocation, and decision-making based on historical performance, empowering organizations to plan and adapt proactively.
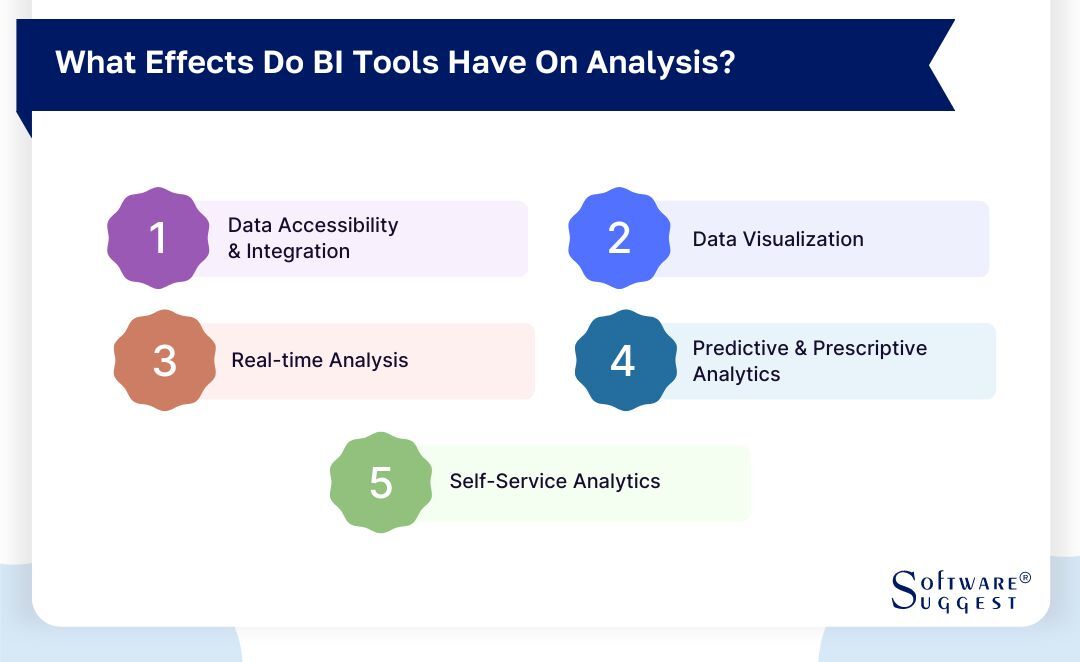
What Effects Do BI Tools Have on Analysis?
Business Intelligence (BI) tools significantly impact analysis within organizations. These tools are developed to gather, process, analyze, and present data to help businesses make informed decisions. The effects of BI tools on analysis are manifold -
-
Data Accessibility and Integration
BI tools provide a platform to gather data from various sources, whether internal (like databases, spreadsheets, and CRM systems) or external (like social media and market data). They facilitate the integration of disparate data sources, ensuring a comprehensive view of the business landscape.
-
Data Visualization
BI tools offer advanced visualization capabilities, turning complex data sets into easily understandable graphs, charts, and dashboards. Visual representations aid in spotting trends, patterns, and outliers that might be otherwise difficult to identify in raw data.
-
Real-time Analysis
Many BI tools allow real-time data analysis, enabling organizations to make swift decisions based on up-to-the-minute information. This is particularly crucial in fast-paced industries where timely decision-making is essential.
-
Predictive and Prescriptive Analytics
Advanced BI tools often incorporate predictive and prescriptive analytics features. They use historical data to make predictions about future trends and suggest actions to optimize outcomes.
-
Self-Service Analytics
Many BI tools offer self-service capabilities, enabling business users to create reports and dashboards without heavily relying on IT teams. This empowers departments to gain insights on their own, fostering a data-driven culture.
BI tools have a transformative effect on analysis within organizations. They enable efficient data handling, better decision-making, and enhanced collaboration, ultimately contributing to improved business outcomes.
How to Choose the Right Business Intelligence Software?
Selecting the right business intelligence software is a critical decision for organizations looking to harness the power of data and gain a competitive edge. Let's explore essential considerations and provide a guide on how to choose the right business intelligence software for your organization.
-
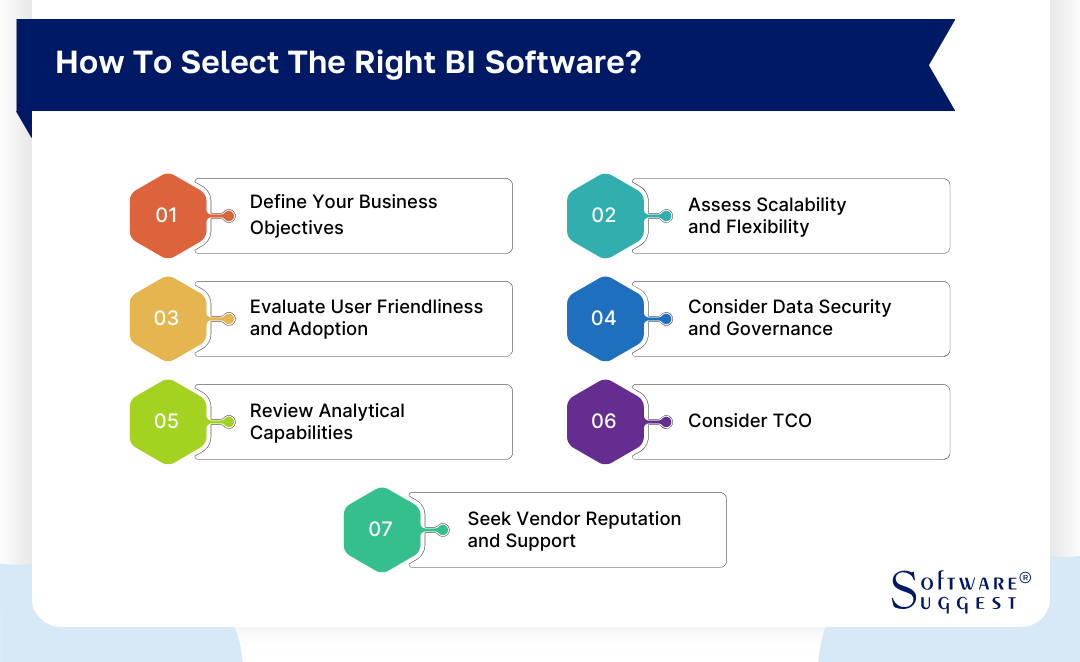
Define Your Business Objectives
Before diving into the selection process, defining your organization's business objectives and the specific goals you want to achieve through business intelligence software is crucial. Identify the key challenges, pain points, and opportunities you intend to address.
Whether improving decision-making, increasing operational efficiency, or gaining competitive insights, a clear understanding of your objectives will help you evaluate software options more effectively.
-
Assess Scalability and Flexibility
Consider the scalability and flexibility of the business intelligence software. Assess whether the software can accommodate your organization's data volumes and processing requirements. Additionally, evaluate whether the solution can scale and handle increased data volumes as your organization grows.
Look for software that supports various data sources and formats and integration capabilities with existing systems. Flexibility in customization and adaptability to changing business needs is also crucial.
-
Evaluate User Friendliness and Ease of Adoption
User-friendliness and ease of adoption are essential factors to consider. The software should have an intuitive interface that allows users with varying technical skills to navigate and interact with the system easily.
Look for drag-and-drop functionality, interactive dashboards, and self-service capabilities that empower users to explore and analyze data without extensive technical knowledge. Additionally, consider the availability of training and support resources to facilitate smooth onboarding and user adoption.
-
Consider Data Security and Governance
Data security and governance are paramount when selecting business intelligence software. Evaluate the security measures implemented by the software provider, such as data encryption, access controls, and compliance with industry regulations.
Assess the software's ability to integrate with existing security protocols and ensure that sensitive data remains protected throughout the analytics process. Additionally, consider features that enable data governance, such as data lineage, auditing, and role-based access control.
-
Review Analytical Capabilities
Assess the analytical capabilities of the business intelligence software to ensure that it meets your organization's needs. Consider the types of analytics supported, such as descriptive, diagnostic, predictive, and prescriptive analytics.
Evaluate the software's ability to handle complex data analysis, perform advanced calculations, and support statistical models. Look for features like data visualization, drill-down capabilities, and the ability to create custom reports and dashboards. The software should empower users to derive meaningful insights from data and facilitate informed decision-making.
-
Consider Total Cost of Ownership (TCO)
Evaluate the total cost of ownership (TCO) associated with implementing and maintaining the business intelligence software. Consider both upfront costs, such as licensing fees, implementation costs, and hardware requirements, as well as ongoing costs, including support, maintenance, and training. Assess the scalability of pricing models and determine if they align with your organization's growth plans. Additionally, consider the return on investment (ROI) potential of the software by weighing the benefits it provides against the associated costs.
-
Seek Vendor Reputation and Support
Research the reputation and track record of the software vendor. Look for customer reviews, case studies, and testimonials to assess the vendor's credibility, product quality, and customer satisfaction.
Consider the vendor's business intelligence experience and ability to provide reliable technical support and regular software updates. A strong vendor-partner relationship is crucial for successful implementation and long-term support of the software.
What are the Best BI Tools on the Market?
|
Name
|
Free Trial
|
Demo
|
Starting Price
|
|---|---|---|---|
|
14 Day |
Yes |
Starting price $250 | |
|
Yes |
Yes |
Custom pricing | |
|
Not Specified |
Yes |
$14000 Per Year | |
|
60 Days |
Yes |
Starting price $9.99/month | |
|
15 Days |
Yes |
Starting price $24/user/month |
The business intelligence software market has various options, each offering unique features and functionalities to help organizations make sense of their data.
While preferences may vary depending on specific business needs, below is a BI software list of some of the top business intelligence software options available today, known for their robust features and industry recognition.
1. Datapine
Datapine is a business intelligence software that empowers organizations to transform their raw data into meaningful insights. It offers a user-friendly interface and a full set of data analytics, reporting, and visualization capabilities.
Businesses may quickly connect to numerous data sources, including databases, spreadsheets, and cloud services, with Datapine in order to collect and analyze data from diverse departments and systems. One of its primary advantages is Datapine's drag-and-drop dashboard builder, which enables users to construct customized dashboards without the need for coding or technical knowledge.
Users of these dashboards can watch key performance indicators (KPIs), identify trends, and make data-driven choices by using real-time, interactive displays of data that can be customized to specific user roles.
- Data connection and integration
- Drag-and-drop dashboard Builder
- Data visualization
- Real-time data monitoring
- Advanced Analytics
- Collaboration and sharing
- Data security
- Scalability and flexibility
- Customer support solution
- Datapine tool has the best data connectors that allow teams to get all our internal and external sources of information in just one place without any problem.
- The software has an intuitive user interface, especially within the analyzer (drag & drop).
- The dashboard templates helped to create visually appealing dashboards.
- The software provides many different reporting options.
- Customer support is really helpful.
- The 14-day trial period is not enough to test all the software features.
- Some advanced functions need SQL knowledge.
Pricing
- Basic: $249 per month
- Professional: $449 per month
- Premium: $799 per month
- Branding & embedded: $1099 per month
- Enterprise: Contact the sales team
2. Sisense
Sisense is one of the latest business intelligence tools that makes it simple for enterprises to evaluate and present complex data. Sisense, renowned for its user-friendly interface and powerful features, enables users to explore and extract insights from massive and diverse data sources. Thanks to the software's sophisticated data modeling and aggregation tools, users can combine data into a single view for in-depth study.
Sisense makes generating visually beautiful and engaging visualizations simple thanks to its user-friendly drag-and-drop interface and interactive dashboards. Sensitive data is safeguarded throughout the analytics process because of Sisense's strong data security and governance capabilities. Sisense is generally a well-liked option for businesses seeking a complete and user-friendly business intelligence solution to support data-driven decision-making.
- Business intelligence
- Data virtualization
- Drone analytics
- Enterprise search software
- Insight engines
- Predictive analytics software
- Statistical analysis
- Text analysis
- Data integration
- Data modeling and transformation
- Customer support is straightforward and well-responsive.
- Data discovery is effective.
- Big data services are amazing and secure.
- Easy integration of APIs.
- Various plans are available, but still, they lack a reliable plan.
- The software has some random stability issues.
- More widget download options can be added.
Pricing
-
On request
3. SAP BUSINESSOBJECTS
One of the top enterprise software providers, SAP, offers SAP BusinessObjects, a comprehensive business intelligence tool. It offers a variety of tools and functionalities to aid in the analysis, visualization, and understanding of data by companies.
Users of SAP BusinessObjects can produce interactive reports, dashboards, and ad hoc searches and access data from various sources, including databases, spreadsheets, and business applications. The powerful reporting features of SAP BusinessObjects are one of its main advantages.
With its many reporting capabilities, users may build pixel-perfect reports, interactive dashboards, and simple visualizations. Users of various technical skill levels can utilize the software because of its drag-and-drop capability and user-friendly interface.
- Powerful search and browse functionality
- Combined data
- Preconfigured, customizable templates
- Ad hoc reporting
- Intuitive interface
- Streamline operations
- Industry and business-specific offerings
- The software provides a seamless graphical user interface.
- The software has sharing functions and Microsoft Office compatibility.
- The software provides great flexibility and functionality.
- Sometimes the server shuts down due to heavy loads.
- The software has poor customer support and platform administration.
- Expensive licensing and overall pricing.
Pricing
-
On Request
4. Microsoft Power BI
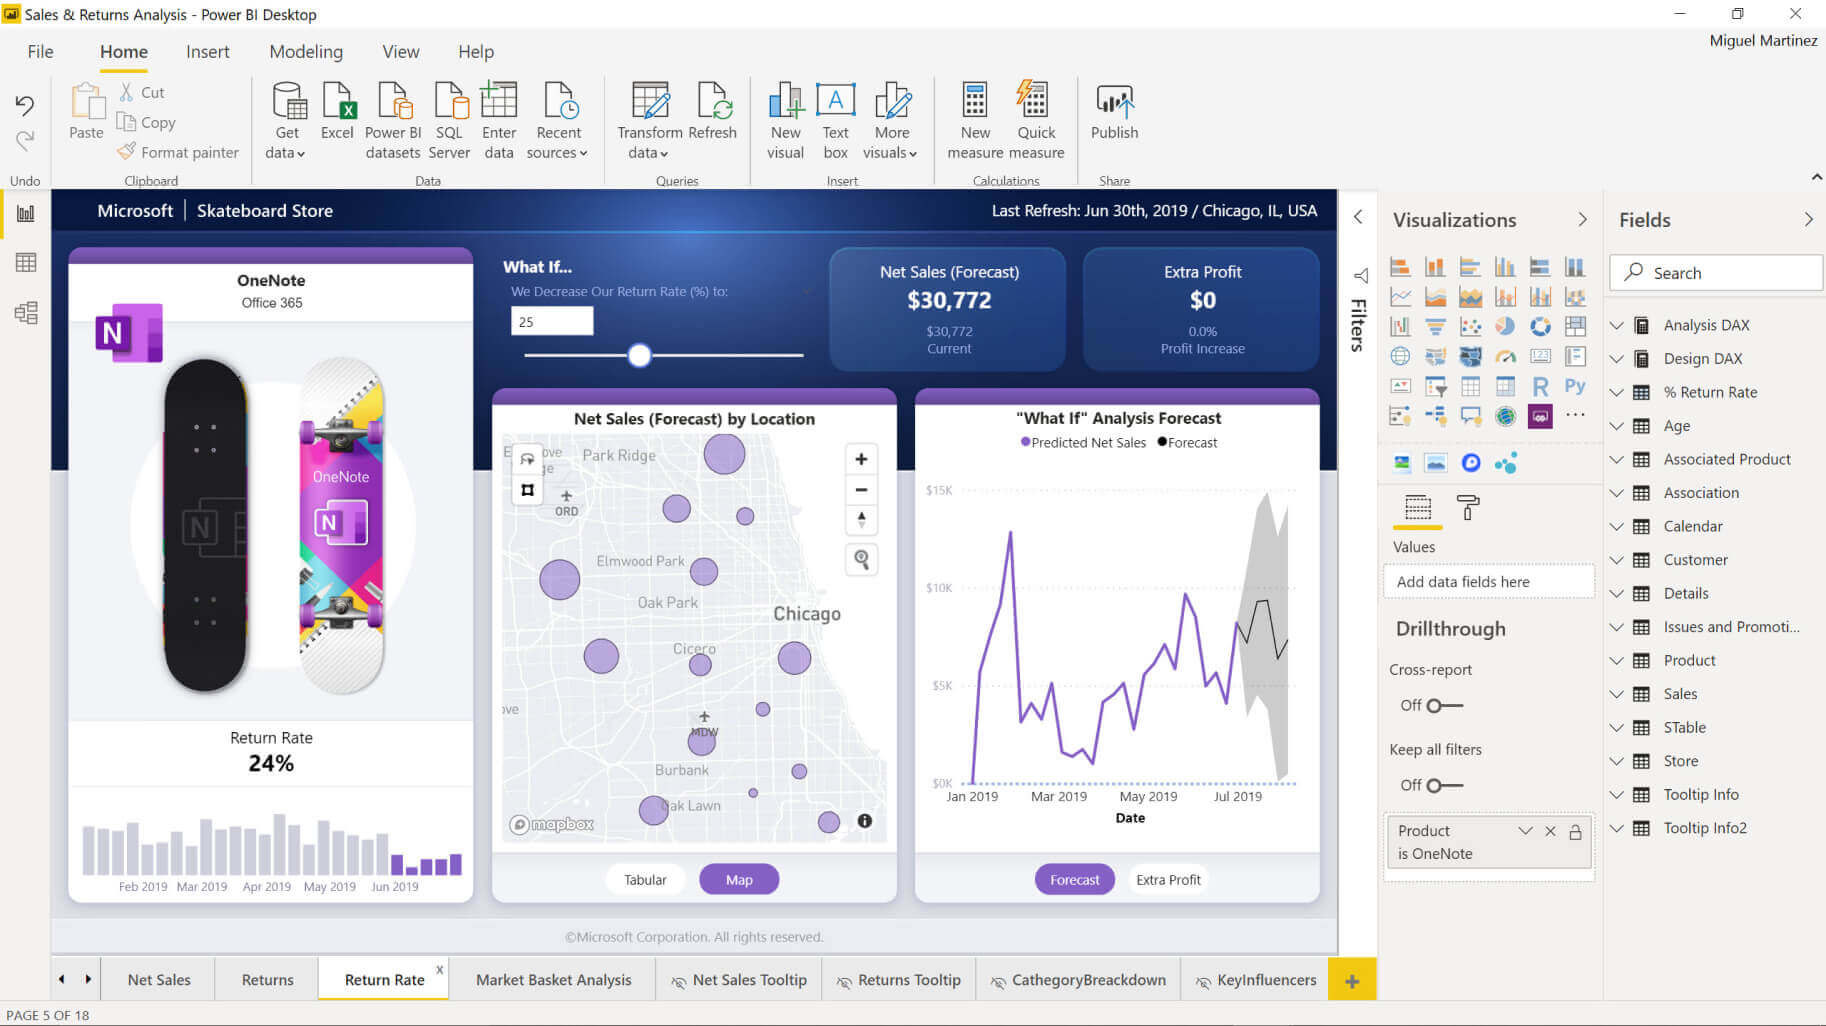
Microsoft Power BI is a powerful business intelligence platform that enables organizations to analyze, visualize, and share data insights in an intuitive and user-friendly manner. As part of the Microsoft ecosystem, Power BI seamlessly integrates with other Microsoft tools and services, making it a popular choice for businesses already using Microsoft products.
With Power BI, users can connect to various data sources, including databases, spreadsheets, and cloud services, to consolidate and transform data for analysis. The platform offers a drag-and-drop interface and a wide range of data visualization options, allowing users to create interactive dashboards, reports, and charts that are visually appealing and easy to understand.
- Data connectivity
- Data transformation and modeling
- Data visualization
- Dashboards and reports
- Natural language queries
- Data exploration and discovery
- Collaboration and sharing
- Mobile Access
- Advanced Analytics
- Security and governance
- The software has great visualization.
- The software can be opened from mobile and desktop and anywhere.
- The software can be linked with many sources.
- The software has a user-friendly UI, and its AI is very helpful.
- The cost model could improve for the premium tier.
- The new UI should be simpler to view from an admin side of view.
- The software has some compatibility issues With Mac.
Pricing
- Power BI Pro: $9 Per user/month
- Power BI Premium: $20 Per user/month
5. Zoho Analytics
 The comprehensive business intelligence and data analytics platform Zoho Analytics is made available by Zoho Corporation. Robust reporting, data visualization, and advanced analytics capabilities enable businesses to turn their data into useful insights.
Users can connect to various data sources, including databases, cloud services, spreadsheets, and on-premises applications, using the user-friendly interface offered by Zoho Analytics. It can integrate both structured and unstructured data, making it flexible.
Users can quickly analyze and visualize their data using various interactive charts, graphs, and dashboards using Zoho Analytics. With its drag-and-drop interface, users may build bespoke reports and dashboards without learning difficult coding or possessing specialized knowledge.
- Data integration solution
- Data preparation and cleaning
- Interactive reporting
- Ad hoc analysis
- Advanced Analytics
- Collaboration and sharing
- Mobile Access
- Data security software
- Embedding and integration
- Scalability and customization
- The software provides comprehensive reports and analytics.
- The software provides integration of business data from our other Zoho apps.
- Packed with features for all business intelligence reporting.
- The software provides many customization options.
- There should be more visualization metrics.
- The tool should provide more learning resources.
- The tool should provide more templates.
Pricing
Cloud-
- Basic: $24 /month billed yearly
- Standard: $48/month billed yearly
- Premium: $115/month billed yearly
- Enterprise:$455/month billed yearly
On-premise-
- Personal: Free Forever
- Professional: $30/user/month billed annually, Min. of 5 users
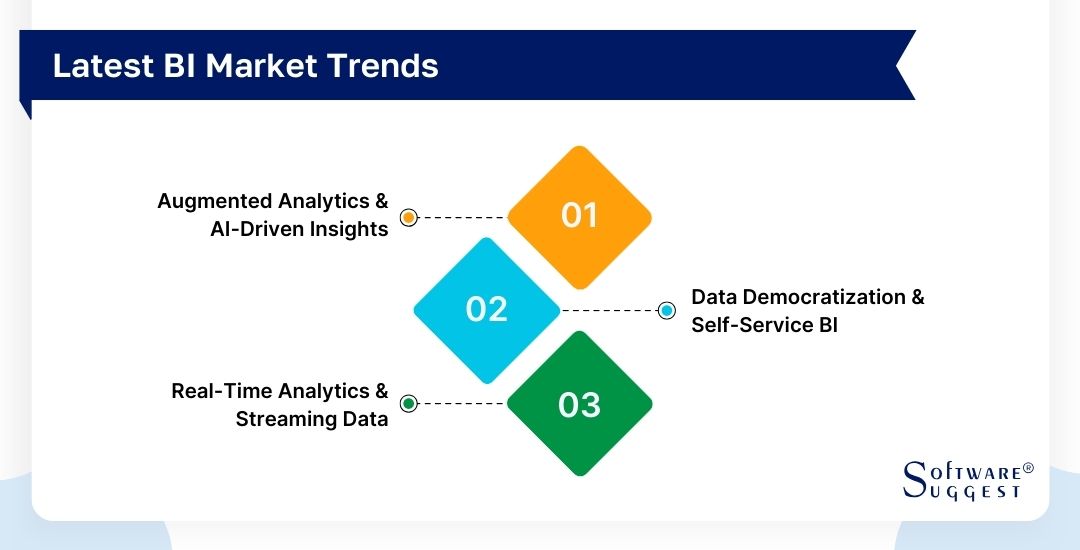
Latest BI Trends to Look Out For!
Want to keep up with your competitors? Then, you need to remain up-to-date with the emerging trends in BI. This can also impact the selection process of BI tools. Below are the three main trends you need to consider.
-
Augmented Analytics and AI-driven Insights
One of the most significant trends in BI is the integration of artificial intelligence (AI) and machine learning (ML) into web analytics tools. BI tools are becoming more intelligent and capable of automatically identifying trends, anomalies, and correlations in data. Moreover, Natural language processing (NLP) and conversational analytics are being used to enable users to interact with BI tools using plain language. This makes data analysis more accessible to non-technical users.
-
Data Democratization and Self-Service BI
There is a growing emphasis on democratizing data within organizations, allowing non-technical users to access and analyze data without relying on IT or data scientists. Self-service BI tools empower business users to create their reports, dashboards, and visualizations. Data governance and security are critical in this trend to ensure that data is accessible to the right people while protecting sensitive information. Role-based access controls and data lineage tracking are becoming standard features.
-
Real-time Analytics and Streaming Data
Modern BI tools are integrating with streaming data sources and processing data in real time to provide instant insights. Use cases for real-time analytics span various industries, including finance (real-time fraud detection), e-commerce (personalized recommendations), and IoT (monitoring equipment performance).
Conclusion
In conclusion, business intelligence software has become an indispensable tool for companies seeking a competitive edge in today's corporate environment. This program enables businesses to make data-driven decisions, streamline operations, and accomplish their strategic goals by efficiently gathering, analyzing, and visualizing data.
Users may discover insights, spot patterns, and react to market trends in real-time thanks to its wide range of features, including data integration, cleansing, analysis, and reporting. Business intelligence software has developed into an essential tool for enterprises of all sizes, assisting them in navigating the complexity of today's data-driven environment and fostering success. It has the capacity to transform raw data into actionable insights.
FAQs
Data is gathered, arranged, analyzed, and presented by business intelligence (BI) systems to enhance decision-making and offer insights into business operations. Data is first collected from various sources, including databases, spreadsheets, and external systems. To guarantee accuracy and consistency, this data is then processed and purified.
After being prepared, the data is kept in a central data warehouse or data mart where BI tools can access and analyze it. These tools include advanced analytics capabilities, data visualization applications, and reporting and querying tools. Users can produce visualizations to better understand trends, patterns, and relationships within the data or make queries and reports to access specific data.
Business intelligence systems also incorporate data analysis techniques, such as data mining, statistical analysis, and predictive modeling, to uncover insights and forecast future outcomes. These analyses can help identify opportunities, detect anomalies, optimize processes, and support strategic decision-making.
A business intelligence platform should provide comprehensive functionalities to support the entire data analytics lifecycle and enable organizations to derive valuable insights from their data. Here are some key aspects of what a business intelligence platform should do.
The platform should have the capability to connect to various data sources, both internal and external, and facilitate data integration. It should support various data formats and offer seamless connectivity to databases, cloud services, APIs, and other relevant sources.
A business intelligence platform should provide tools and features for data cleansing, transformation, and enrichment. This includes data profiling, data quality assessment, data standardization, and the ability to handle missing or inconsistent data.
The platform should offer capabilities to model and structure the data, allowing for efficient storage and retrieval. It should support data warehouses, data marts, and data lakes, enabling organizations to store and organize large volumes of data for analysis.
In order to collect, analyze, and turn raw data into valuable insights that support informed decision-making within enterprises, business intelligence software is utilized. It is essential for sifting through massive amounts of data to find the information that will help firms understand their operations, spot trends, and make strategic decisions.
Software for business intelligence enables users to connect to various data sources, including databases, spreadsheets, and cloud services, and to compile those sources' contents into a single location. In order to make sure that the data is precise, consistent, and prepared for analysis, it offers tools for data integration, cleansing, and modeling.
By Countries
By Industries