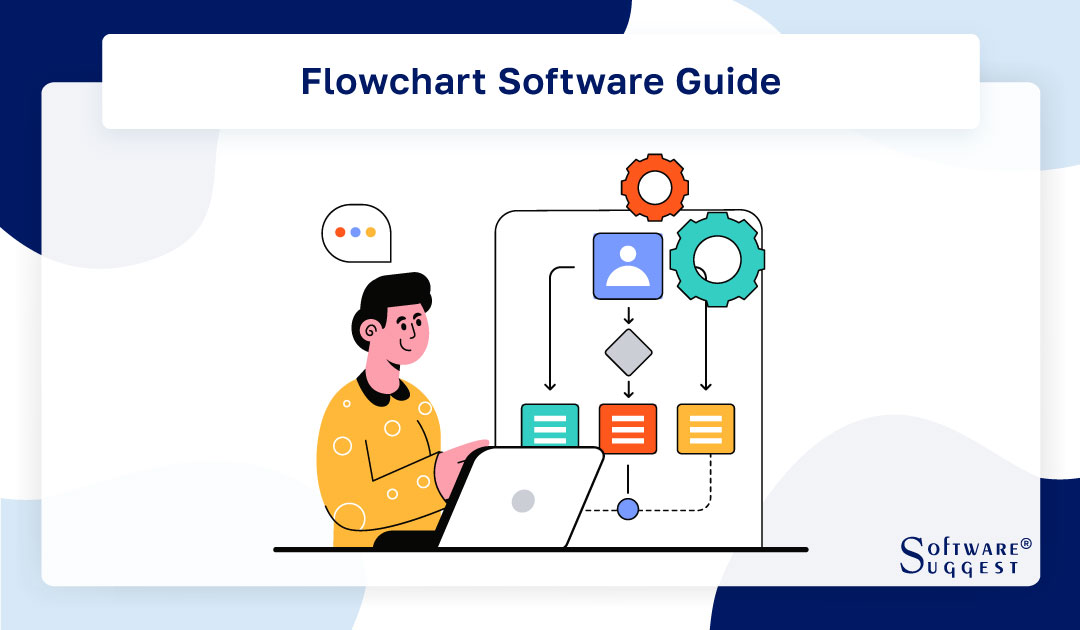
Best Flowchart Software
Best flowchart software systems are EDraw Max, Lucid Chart, Cacoo, SmartDraw, and Creately. This online flowchart software creates a sequenced diagram, often of interconnected shapes, outlining a plan's idea's flow, hierarchy, order, or structure.


No Cost Personal Advisor
List of 20 Best Flowchart Software
Contenders | 2024
Software by Lucid Software
Lucidchart is a widely used flowchart software. Users can enhance organizational systems, structures, and processes by generating, editing, and sharing charts and diagrams visually with one another. Online diagramming tool Lucidchart is simple to use, has excellent teamwork capabilities, and provides a wealth of templates. This cloud-based program is the ideal flowchart tool because it functions flawlessly on all major operating systems. Read Lucidchart Reviews
Explore various Lucidchart features, compare the pricing plans, and unlock the potential of seamless operations by selecting the right software for your business.
Features
View all Lucidchart Features- Project Planning
- Flowchart
- Presentation Tools
- Templates
- Diagramming
- Roadmapping
Pricing
Lucidchart Caters to
- StartUps
- SMBs
- Agencies
- Enterprises
Contenders | 2024
Unlimited Collaboration
Creately is a renowned online flowchart tool for individuals and teams. It is a digital workspace to plan, design, and analyze systems, ideas, processes, plans, schemes, and more. Different forms can be used by businesses, including whiteboarding, diagramming, and video conferencing. Creately is simple and easy to use. Any user can start creating useful diagrams within a few minutes. Read Creately Reviews
Explore various Creately features, compare the pricing plans, and unlock the potential of seamless operations by selecting the right software for your business.
Features
View all Creately Features- Project Planning
- Data Security
- Hierarchical Mapping
- Photos / Images
- Mind Map
- Organizational Charting
- Brainstorming
- For Manufacturers
Pricing
Creately Caters to
- StartUps
- SMBs
- Agencies
- Enterprises
Contenders | 2024
Software by Microsoft Corporation
Microsoft Visio is one of the best flowchart software for drawing a variety of diagrams. These include flowcharts, org charts, swimlane diagrams, building plans, floor plans, process flow diagrams, business process modeling, data flow diagrams, 3D maps, and many more. It is a functional application for diagramming and vector graphics. Read Visio Reviews
Explore various Visio features, compare the pricing plans, and unlock the potential of seamless operations by selecting the right software for your business.
Features
View all Visio Features- Templates
- Diagramming
- Flowchart
- Organizational Charting
- Collaboration
Pricing
Visio Online Plan 1
$ 5
User/Month
Visio Online Plan 2
$ 17
User/Month
Visio Caters to
- StartUps
- SMBs
- Agencies
- Enterprises
Contenders | 2024
Software by SmartDraw Software LLC
SmartDraw is a chart and diagram tool that helps businesses handle diagramming processes. This is done through templates that help develop infographics, mind maps, network designs, organizational charts, and more. Key features include document retention, customizable extensions, single sign-on (SSO), and collaboration. SmartDraw offers useful flowchart tools that businesses can use to generate architectural diagrams by using automated spacing, alignment, sizing, and color schemes. Read SmartDraw Reviews
Explore various SmartDraw features, compare the pricing plans, and unlock the potential of seamless operations by selecting the right software for your business.
Features
View all SmartDraw Features- Documentation Management
- Portfolio Management
- Proposal Management
- 2D Drawing
- Billing & Invoicing
- Project Management
- 3D Modeling
- Task Management
Pricing
Starter
$ 297
Onetime
SmartDraw Caters to
- StartUps
- SMBs
- Agencies
- Enterprises
Contenders | 2024
Software by RealtimeBoard
Miro Collaboration is one of the best flowchart programs. It is an online whiteboard. Like a physical whiteboard, it allows users to add various content from texts to images, create maps and diagrams, and work with visual templates together with a team. It offers tools that users need to collaborate remotely, ranging from designing to execution. Read Miro Collaboration Reviews
Explore various Miro Collaboration features, compare the pricing plans, and unlock the potential of seamless operations by selecting the right software for your business.
Features
View all Miro Collaboration Features- Status Tracking
- Collaboration
- Video Conferencing
- Creator Tracking
- Idea Ranking
- Feedback Collection
- Task Management
- Resource Management
Miro Collaboration Caters to
- StartUps
- SMBs
- Agencies
- Enterprises
Emergents | 2024
An Online Software for Creating Flowcharts
Zen Flowchart is simple online flowchart software. It aids users to develop flowcharts, flow charts, organizational charts, process charts, sitemaps, and more. Zen Flowchart is a great tool for helping users manage their time and workload better. This online flowchart maker is easy and delightful since it offers a minimal and intuitive user interface. Businesses can easily create professional flowcharts and diagrams. Learn more about Zen Flowchart
Explore various Zen Flowchart features, compare the pricing plans, and unlock the potential of seamless operations by selecting the right software for your business.
Pricing
Standard
$ 0
Per Month
Pro
$ 5
Per Month
Zen Flowchart Caters to
- StartUps
- SMBs
- Agencies
- Enterprises
Emergents | 2024
Software by Gliffy, Inc.
Gliffy is website wireframe tools for planning, creating, sharing and editing mockups and wireframe. It seamlessly integrates with Confluence, JIRA, and Google Drive. It has a user-friendly interface and helps you communicate and collaborate better thus increasing your efficiency. Learn more about Gliffy
Explore various Gliffy features, compare the pricing plans, and unlock the potential of seamless operations by selecting the right software for your business.
Features
View all Gliffy Features- Mockup Creation
- Desktop Interface
- Collaboration
- Revision History
- Drag & Drop
- Wireframe Creation
Pricing
Professional
$ 8
Month/Billed Annually
Team
$ 5
User/Month/Billed Annually
Gliffy Caters to
- StartUps
- SMBs
- Agencies
- Enterprises
Emergents | 2024
Software by JGraph
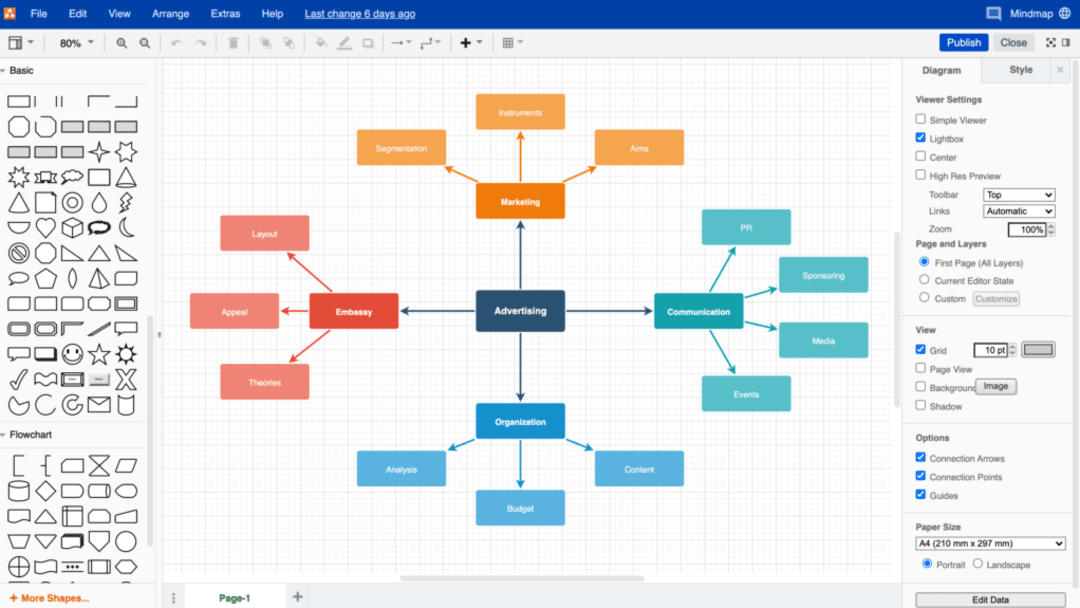
Draw.io is a free online diagramming tool that enables businesses to create flowcharts, diagrams, floor plans, process charts, mind maps, hierarchy charts, organization charts, and much more. This is a web-based application. Draw.io is a flowchart program that is fully integrated with Google Drive. Hence, users can automatically save the process of their work in Google Workspace or Gmail accounts. Learn more about draw.io
Explore various draw.io features, compare the pricing plans, and unlock the potential of seamless operations by selecting the right software for your business.
Features
View all draw.io Features- Process Mapping
- Organizational Charting
- Flowchart
- Collaboration
- Revision Management
- Mind Map
- Drag & Drop
- Multi-User Collaboration
draw.io Caters to
- StartUps
- SMBs
- Agencies
- Enterprises
Contenders | 2024
Software by EdrawSoft
Businesses can create a variety of diagrams for use as illustrations using Edraw Max, an all-in-one diagram creation tool. This top flowchart software is an all-in-one diagram software designed to create professional-looking flowcharts, organizational charts, business presentations, network diagrams, fashion designs, building plans, mind maps, science illustrations, UML diagrams, workflows, program structures, web designs, and more. Read EDraw Max Reviews
Explore various EDraw Max features, compare the pricing plans, and unlock the potential of seamless operations by selecting the right software for your business.
Features
View all EDraw Max Features- Publishing / Sharing
- Templates
- Collaboration
- Organizational Charting
- Interactive Elements
- Diagramming
- Revision History
- Photos / Images
EDraw Max Caters to
- StartUps
- SMBs
- Agencies
- Enterprises
Emergents | 2024
Software by Omni Group
OmniFocus is powerful task management software for professionals who love to multitask. OmniGraffle offers useful flowchart drawing tools to create diagrams, graphics, charts, and visuals. A drag-and-drop smart interface, a number of design tools, and a notes feature are all included in the program. These capabilities allow users to interpret and produce specification documents for prototypes and mockups. Learn more about OmniGraffle Pro
Explore various OmniGraffle Pro features, compare the pricing plans, and unlock the potential of seamless operations by selecting the right software for your business.
Features
View all OmniGraffle Pro Features- Templates
- Organizational Charting
- For Developers
- Data Import / Export
- Flowchart
- Mind Map
- Multi-User Collaboration
- Drag & Drop
OmniGraffle Pro Caters to
- StartUps
- SMBs
- Agencies
- Enterprises
Category Champions | 2024
Software by Canva
Canva is a flowchart program that makes designing beautiful creative outlines and templates easy for everyone. Canva makes creating social media images, videos, gifs, posters, websites, booklets, and multimedia presentations very simple. This program is invaluable for helping users level up their design skills. Users of Canva get access to a huge library of design layouts that can be used for presentations, social media videos, posters, flyers, invites, and much more. Read Canva Reviews
Explore various Canva features, compare the pricing plans, and unlock the potential of seamless operations by selecting the right software for your business.
Features
View all Canva Features- Recovery of photos from different file formats
- Publishing / Sharing
- Print Management
- Collaboration
- Flowchart
- Contact Management
- Campaign Management
- Templates
Pricing
Free
$ 0
Per Month
Pro
$ 15
Per Month
Enterprise
$ 30
Per Month
Canva Caters to
- StartUps
- SMBs
- Agencies
- Enterprises
Emergents | 2024
Software by Whimsical
Whimsical is one of the best flowchart programs. Whimsical is a platform for collaborative online workstations that helps design, engineering, and product departments promote creativity. Users can create project wireframes, flowcharts, mind maps, and note pads. Whimsical allows editors to create and modify documents, give viewers access to remark on shared documents, and invite visitors to see and work on certain documents. Learn more about Whimsical
Explore various Whimsical features, compare the pricing plans, and unlock the potential of seamless operations by selecting the right software for your business.
Features
View all Whimsical Features- Real Time Editing
- Brainstorming
- Project Management
Whimsical Caters to
- StartUps
- SMBs
- Agencies
- Enterprises
Emergents | 2024
Drawing and Diagramming App
ConceptDraw Solutions offers reliable flowchart drawing tools. It provides business-specific add-ons to assist a broad variety of workflow requirements. ConceptDraw is a versatile diagramming tool that provides for sharing drawings and aids in easy team collaboration through illustrations, presentations, demonstrations, and many export options. A few useful features offered are Task Management, Document Management, Email Integration, Team Collaboration, and more. Learn more about ConceptDraw DIAGRAM v12
Explore various ConceptDraw DIAGRAM v12 features, compare the pricing plans, and unlock the potential of seamless operations by selecting the right software for your business.
- Key Performance Indicators
- Presentation Tools
- Dashboard Creation
- Data Visualization
- Dashboard
ConceptDraw DIAGRAM v12 Caters to
- StartUps
- SMBs
- Agencies
- Enterprises
Emergents | 2024
Software by Visual Paradigm
For a variety of visualisation requirements, Visual Paradigm provides feature-rich online diagramming software with both fundamental and sophisticated functionalities. It has a comprehensive collection of Agile and Scrum project management tools. Visual Paradigm is one of the best flowchart programs for software development teams to oversee development processes and model organizational information systems. Additionally, it offers code engineering and report production capabilities. Learn more about Visual Paradigm
Explore various Visual Paradigm features, compare the pricing plans, and unlock the potential of seamless operations by selecting the right software for your business.
Features
View all Visual Paradigm Features- Batch Processing
- Mobile Support
- Desktop Interface
- Document Analytics
- Mobile Interface
- Screen Capture
- Templates
- Feedback Management
Pricing
Modeler
$ 6
Per Month
Standard
$ 19
Per Month
Professional
$ 35
Per Month
Visual Paradigm Caters to
- StartUps
- SMBs
- Agencies
- Enterprises
Emergents | 2024
Software by Evolus
Pencil Project is open-source prototyping software. It aids companies in creating distinctive user experiences for commonly used desktop platforms. This flowchart program offers eminent features such as inter-page linking, diagram drawing support, graphic designing, clipart browsing, and document exporting. Businesses can download pre-built stencils and templates to help users create quick wireframes. Read Pencil Project Reviews
Explore various Pencil Project features, compare the pricing plans, and unlock the potential of seamless operations by selecting the right software for your business.
Features
View all Pencil Project Features- Data Import / Export
- Page Linking
- For Websites
- Prototyping
- Mobile Interface
- Flowchart
- Drag & Drop
- Diagramming
Pencil Project Caters to
- StartUps
- SMBs
- Agencies
- Enterprises
Emergents | 2024
Software by NCH Software, Inc
ClickCharts is one of the best flowchart programs. This robust flowchart software solution provides all kinds of enterprises with intuitive tools for designing, generating, and visualizing data. ClickCharts is a reliable tool for organizing and meaningfully presenting data and information. Users can create value streams and data flow diagrams. Learn more about ClickCharts
Explore various ClickCharts features, compare the pricing plans, and unlock the potential of seamless operations by selecting the right software for your business.
Features
View all ClickCharts Features- Flowchart
- Mind Map
- Organizational Charting
- Brainstorming
- Collaboration
- Project Tracking
- Idea Ranking
- Diagramming
ClickCharts Caters to
- StartUps
- SMBs
- Agencies
- Enterprises
Emergents | 2024
Advanced Diagramming and Vector Graphics tool
software which offers flowchart tools for creating flowchart diagrams, organizational charts, network diagrams, floor plans, business model diagrams, circulars, leaflets, newsletters, and many more. MyDraw is cross-platform and is compatible for Windows and macOS devices. Additionally, it offers industry-leading Microsoft Visio interoperability, enabling users to import and export diagramming projects from various Visio formats into MyDraw. Learn more about MyDraw
Explore various MyDraw features, compare the pricing plans, and unlock the potential of seamless operations by selecting the right software for your business.
Features
View all MyDraw Features- Drag & Drop
- Organizational Charting
- Data Import & Export
- Interactive Elements
- Data Import / Export
- Mind Map
- Desktop Interface
- Flowchart
Pricing
Basic
$ 69
One Time
MyDraw Caters to
- StartUps
- SMBs
- Agencies
- Enterprises
Emergents | 2024
Convey the most powerful visual stories & content
Visme is flowchart software that helps individuals and teams translate data into engaging content in presentations and infographics. Visme is a cloud-based platform that helps Non-profit organizations, agencies, and marketers develop and share infographics in real time. The software makes it easy for the teams to utilize content blocks and customizable templates to create presentations and data visualizations. Learn more about Visme
Explore various Visme features, compare the pricing plans, and unlock the potential of seamless operations by selecting the right software for your business.
Features
View all Visme Features- Collaboration
- Lead Management
- Image Database
- Performance Management
- Document Management
- Presentation Management
- Content Management
- Image Editor
Visme Caters to
- StartUps
- SMBs
- Agencies
- Enterprises
Contenders | 2024
Online Wireframe Tool by S.C Evercoder Software
The online program Moqups is a smart visual collaboration tool. Moqups is a flowchart drawing tool that combines whiteboard, diagram, and design features in a single platform. Dashboards, wireframes, mockups, mind maps, diagrams, and prototypes are just a few of the visual assets that users can think, link, plan, and display in real-time for every project. Read Moqups Reviews
Explore various Moqups features, compare the pricing plans, and unlock the potential of seamless operations by selecting the right software for your business.
Features
View all Moqups Features- Prototype Creation
- Collaboration
- Revision History
- Interactive Elements
- Drag & Drop
- Wireframe Creation
- Feedback Management
- Desktop Interface
Pricing
Personal
$ 13
Per Month
Moqups Caters to
- StartUps
- SMBs
- Agencies
- Enterprises
Emergents | 2024
Best Idea Management Software
MindManager is one of the best flowchart programs, which quickly captures and transforms ideas into transparent, distinct, mind maps, customizable flowcharts, and timelines to efficiently organize a team or business. MindManager helps with thinking and conception as well as the creative brainstorming process. The visual and organized representation of ideas and information in a map also facilitates decision-making and problem-solving. Learn more about MindManager
Explore various MindManager features, compare the pricing plans, and unlock the potential of seamless operations by selecting the right software for your business.
MindManager Caters to
- StartUps
- SMBs
- Agencies
- Enterprises
Get Free Expert Advice

Flowchart software is a valuable tool that simplifies the visualization of complex processes, workflows, and systems through clear and structured diagrams. With an intuitive interface and a vast library of shapes and symbols, these applications empower professionals across various industries to create informative and visually appealing flowcharts.
From project management and software development to business processes and educational purposes, flowchart software proves to be an indispensable asset, enhancing communication, decision-making, and productivity.
What Is a Flowchart Software?
Flowchart software is a specialized tool designed to create, edit, and visualize flowcharts, diagrams, and process maps in a digital format. Flowcharts are graphical representations of processes or workflows where arrows connect various steps or actions to illustrate the sequence of events.
Flowchart software provides a user-friendly interface that allows users to drag and drop different shapes, symbols, and icons to construct flowcharts efficiently. These tools often come equipped with a wide range of templates, making it easier for users to start their flowcharting projects.
The software also enables users to add text, annotations, and other visual elements to enhance the clarity of the flowchart. In addition to flowcharting, some flowchart software may support other types of diagrams, such as org charts, mind maps, network diagrams, and more.
Flowchart software is widely used across various industries and professions, including project management, process analysis, software development, and system design, to visually represent complex processes and aid in decision-making and communication.
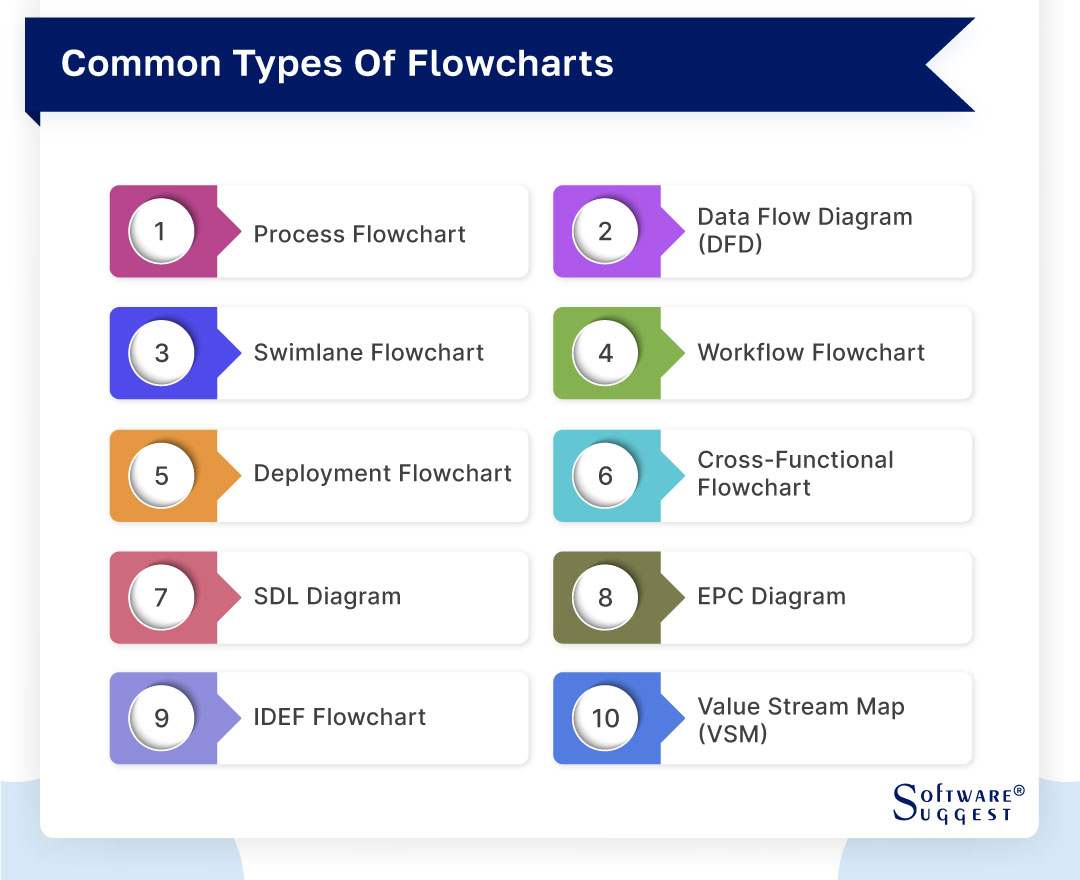
What Are the Common Types of Flowcharts?
Flowcharts are powerful visual tools used to represent processes, workflows, and systems, making complex concepts more understandable. They are widely employed in various industries and disciplines to map out the flow of information, tasks, and resources. Let's explore the common types of flowcharts and their specific uses -
-
Process Flowchart
A Process Flowchart is one of the most common and fundamental types. It illustrates the sequence of steps involved in a process, making it easier to comprehend and analyze the workflow. This flowchart uses different shapes to represent actions, decisions, start and end points, helping to identify inefficiencies and potential improvements within a process.
-
Data Flow Diagram (DFD)
A Data Flow Diagram focuses on the flow of data within a system. It shows how data moves from one process to another, between entities, or between external systems. DFDs are valuable for understanding data dependencies, identifying data sources, and analyzing data transformations in a structured manner.
-
Swimlane Flowchart
A Swimlane Flowchart is an excellent choice for visualizing processes that involve multiple participants or departments. Each participant is assigned a "swimlane" in the chart, making it easy to see their responsibilities, interactions, and handoffs. This type of flowchart improves clarity and accountability in complex workflows.
-
Workflow Flowchart
Workflow Flowcharts focus on representing the specific tasks, decisions, and actions that constitute a particular workflow. They are widely used in project management, outlining the step-by-step progression of tasks and milestones, making it simpler to track and manage project progress.
-
Deployment Flowchart
Deployment Flowcharts are often used in software development and IT projects. They outline the steps and processes involved in deploying a software application or system, including testing, integration, and release stages.
-
Cross-Functional Flowchart
Also known as a Swimlane Flowchart, this type of flowchart visually divides the diagram into lanes representing different departments, teams, or individuals. It highlights the interactions and handoffs between these entities, providing a holistic view of how a process operates across the organization.
-
SDL Diagram
Specification and Description Language (SDL) Diagrams are used in telecommunications and software engineering. They focus on illustrating the interactions and behavior of systems and processes, especially in the context of communication protocols and real-time systems.
-
EPC Diagram
Event-Driven Process Chain (EPC) Diagrams showcase business processes with a focus on events that trigger actions and decision points. They are valuable for modeling complex business processes and analyzing dependencies between events and activities.
-
IDEF Flowchart
IDEF (Integrated Definition) Flowcharts are part of the IDEF methodology for process modeling. They use standardized symbols to represent various elements in a system, facilitating clear communication and understanding of complex processes.
-
Value Stream Map (VSM)
Value Stream Maps are specialized flowcharts used in Lean management and Six Sigma methodologies. They map out the entire value stream, from raw materials to the end product, identifying value-adding steps and opportunities for waste reduction.
How Does Flowchart Software Work?
Flowchart software works by providing a user-friendly interface that allows users to create, edit, and visualize flowcharts and other types of diagrams. The process typically starts with the user selecting a new project or template from the software's library. Users can then begin constructing their flowchart by dragging and dropping various shapes, symbols, and icons onto the canvas. These shapes represent different steps, decisions, and actions in the process.
Once the basic structure of the flowchart is in place, users can connect the shapes using arrows or lines to indicate the flow of the process. This connection between shapes illustrates the sequence of events and the logical progression of the process being depicted. Users can add text and annotations to further clarify each step or decision point within the flowchart.
Flowchart software often offers a wide range of formatting options, allowing users to customize the appearance of the flowchart, such as adjusting colors, line styles, and font sizes. This customization helps make the flowchart visually appealing and easy to understand.
Collaboration features are also a significant aspect of flowchart software. Real-time collaboration enables multiple team members to work simultaneously on the same flowchart, facilitating effective communication and cooperation.
Once the flowchart is complete, it can be saved, exported, or shared with others, either as an image or in various file formats. This sharing capability enables seamless communication and allows stakeholders to review, analyze, and provide feedback on the process being represented.
How to Make a Flowchart Online?
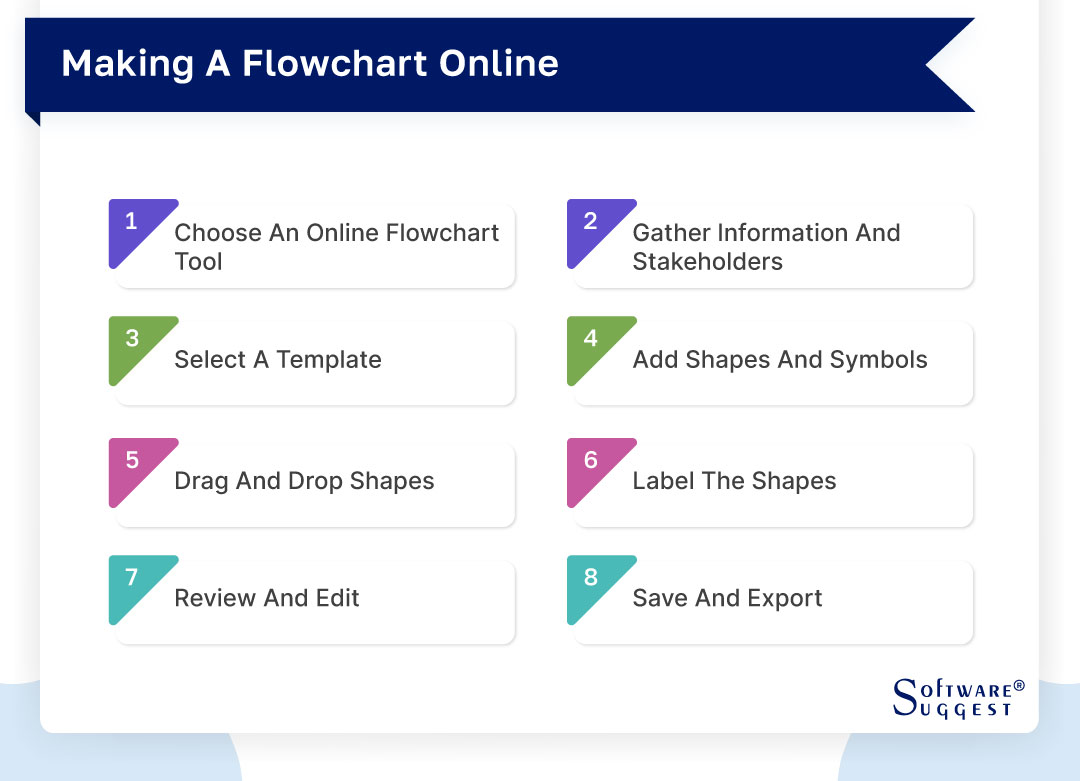
Creating flowcharts online has become increasingly popular due to the convenience of collaborative tools and the ability to access them from anywhere with an internet connection. In this guide, we will walk you through the step-by-step process of making a flowchart online using a web-based flowchart tool.
-
Choose an Online Flowchart Tool
Start by selecting a suitable online flowchart tool. There are numerous options available, each offering different features and functionalities. Look for a tool that aligns with your needs, such as ease of use, collaboration capabilities, and a diverse library of shapes and templates.
-
Gather Information and Stakeholders
Before diving into creating the flowchart, gather all the necessary information and involve relevant stakeholders. Understand the process or system you want to represent in the flowchart, and communicate with team members or subject matter experts to ensure accuracy.
-
Select a Template
Most online flowchart tools provide a variety of templates for different types of flowcharts. Choose a template that best suits your requirements or start with a blank canvas if you prefer to create a custom flowchart from scratch.
-
Add Shapes and Symbols
Once you have your template ready, begin adding shapes and symbols to the canvas. These shapes represent different elements of the flowchart, such as processes, decisions, start and end points, connectors, etc. The flowchart tool's library should offer a wide range of shapes to choose from.
-
Drag and Drop Shapes
Drag and drop the selected shapes onto the canvas and arrange them in the appropriate sequence to depict the flow of the process or workflow. You can easily move and adjust the shapes as needed to create a clear and organized diagram.
-
Label the Shapes
After placing the shapes on the canvas, add text labels to each shape to provide context and describe the actions or processes they represent. Clear and concise labeling ensures easy understanding for viewers.
-
Review and Edit
Take some time to review the flowchart for accuracy and completeness. Double-check the sequence of the steps and the connections between shapes. Edit and adjust the flowchart as necessary to improve its clarity and coherence.
-
Save and Export
Once you are satisfied with the flowchart, save your work on the online flowchart tool platform. This will allow you to revisit and edit it in the future. Additionally, most tools offer options to export the flowchart in various formats, such as PDF, PNG, or JPEG, enabling you to share it with colleagues or embed it in presentations or documents.
The Best Flowchart Practices to Implement
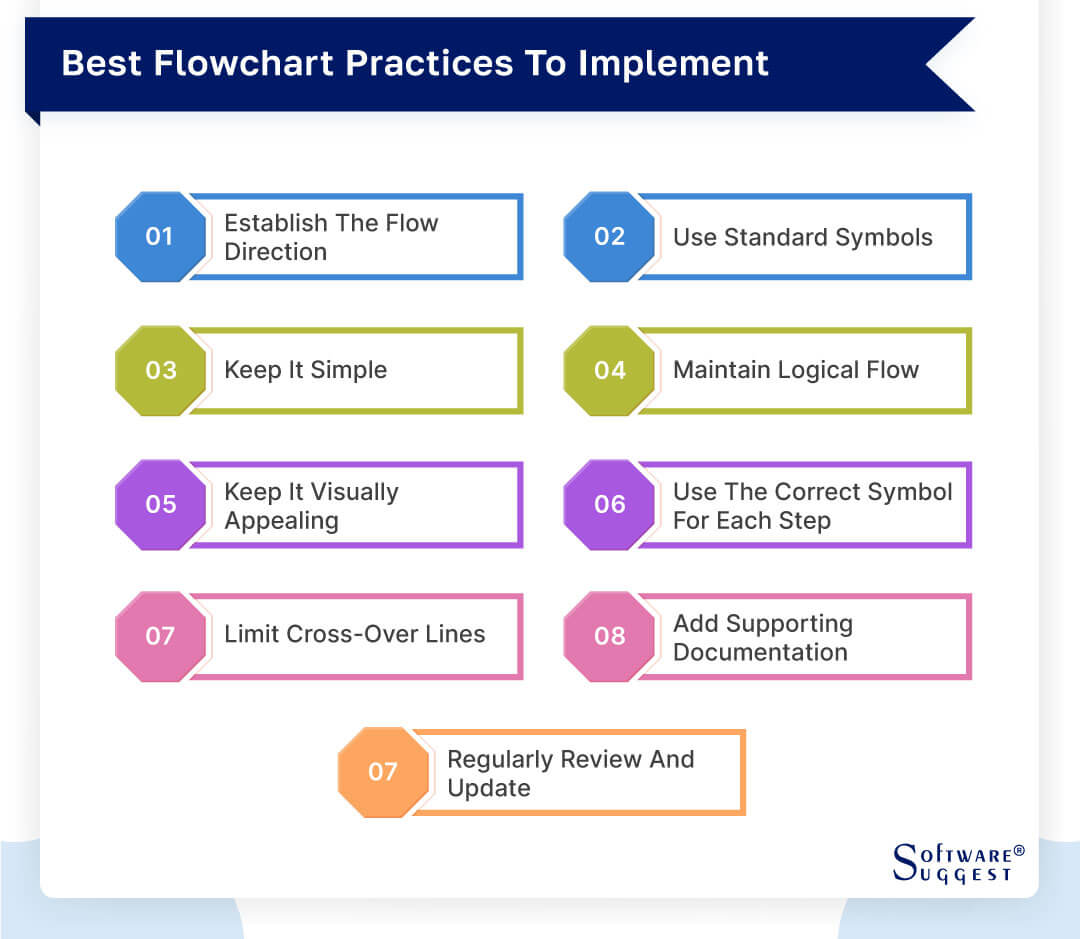
Flowcharts are valuable tools for visualizing processes, workflows, and systems, enabling clear communication and analysis. To ensure flowcharts effectively serve their purpose, it is essential to follow best practices during their creation. In this description, we will explore the best flowchart practices that you should implement to create clear, logical, and visually appealing diagrams.
-
Establish the Flow Direction
A well-structured flowchart should have a clear flow direction, typically from top to bottom or from left to right. Consistency in the flow direction ensures that the diagram is easy to follow, and users can quickly understand the sequence of steps involved in the process.
-
Use Standard Symbols
Adhere to the use of standard flowchart symbols and conventions. Standard symbols ensure universality and prevent confusion among users. Using recognized shapes for processes, decisions, start and end points, connectors, etc., promotes consistency and simplifies comprehension.
-
Keep it Simple
Avoid unnecessary complexity in your flowchart. Keep the diagram as simple as possible while still conveying the essential information. Overcrowded or convoluted flowcharts may confuse readers and defeat the purpose of visual representation.
-
Maintain Logical Flow
Ensure that the flow of your flowchart follows a logical sequence of steps. Each process should lead naturally to the next, and decision points should be clear and well-structured. A logical flow enhances the flowchart's effectiveness and makes it more user-friendly.
-
Keep it Visually Appealing
Design your flowchart to be visually appealing and easy on the eyes. Use appropriate colors, fonts, and spacing to create a harmonious layout. A well-designed flowchart not only looks professional but also enhances engagement and understanding.
-
Use the Correct Symbol for Each Step
Ensure that you use the correct flowchart symbols to represent each step or action accurately. Misusing symbols can lead to misinterpretations and errors in understanding the process.
-
Limit Cross-Over Lines
Minimize the use of cross-over lines in your flowchart. Crossed lines can create confusion and make it challenging to trace the flow of the process. Whenever possible, use alternative routing or connectors to keep the lines clean and organized.
-
Add Supporting Documentation
For more complex flowcharts or those used in professional settings, consider adding supporting documentation or annotations. This can include textual descriptions, notes, or links to additional resources, providing additional context and clarity.
-
Regularly Review and Update
Flowcharts should be treated as living documents that require periodic review and updates. As processes or workflows change over time, make sure to reflect those changes in the flowchart to keep it accurate and relevant.
Key Benefits of Flowchart Software
Flowchart software offers a variety of key benefits that significantly enhance various aspects of business processes and decision-making. Through visual representation, process mapping, communication, collaboration, documentation, standardization, organizational optimization, effective analysis, and problem-solving, flowchart software becomes an indispensable tool for professionals across different industries. Let's delve into each of these key benefits:

-
Visual Representation
Flowchart software provides a visual way to represent complex processes and workflows. By using shapes, symbols, and arrows, users can easily create diagrams that help convey intricate concepts in a clear and concise manner. Visual representation aids in understanding processes at a glance, making it simpler for stakeholders to grasp the workflow and identify potential improvements.
-
Process Mapping
Flowchart software enables users to map out detailed processes step-by-step. This process mapping helps identify bottlenecks, inefficiencies, and areas for improvement within a workflow. By visualizing the entire process, teams can streamline operations, optimize resource allocation, and enhance overall productivity.
-
Communication and Collaboration
Flowchart software fosters effective communication and collaboration among team members. Teams can work together on the same diagram in real-time, exchanging ideas, providing feedback, and making changes collaboratively. This feature is especially valuable for remote teams or geographically dispersed colleagues who need to cooperate seamlessly.
-
Documentation and Standardization
Flowchart software serves as a valuable documentation tool, enabling the recording and preservation of essential processes and procedures. Standardizing processes through flowcharts ensures consistency across the organization, reducing errors and enhancing operational efficiency.
-
Organizational Optimization
Flowchart software plays a crucial role in optimizing organizational workflows. By analyzing the flowcharts, businesses can identify areas of redundancy or inefficiency and implement necessary improvements. Streamlining processes leads to cost reductions, increased productivity, and better resource utilization.
-
Effective Analysis
Flowchart software facilitates data-driven analysis by visualizing data flows and decision points within a process. This enables professionals to identify patterns, trends, and potential areas of concern, aiding in data-driven decision-making and continuous process improvement.
-
Problem-Solving
Flowcharts are valuable tools for problem-solving and troubleshooting. They help break down complex issues into manageable steps, allowing teams to identify the root causes of problems and devise effective solutions. This systematic approach to problem-solving minimizes the risk of overlooking critical factors and promotes efficient resolution.
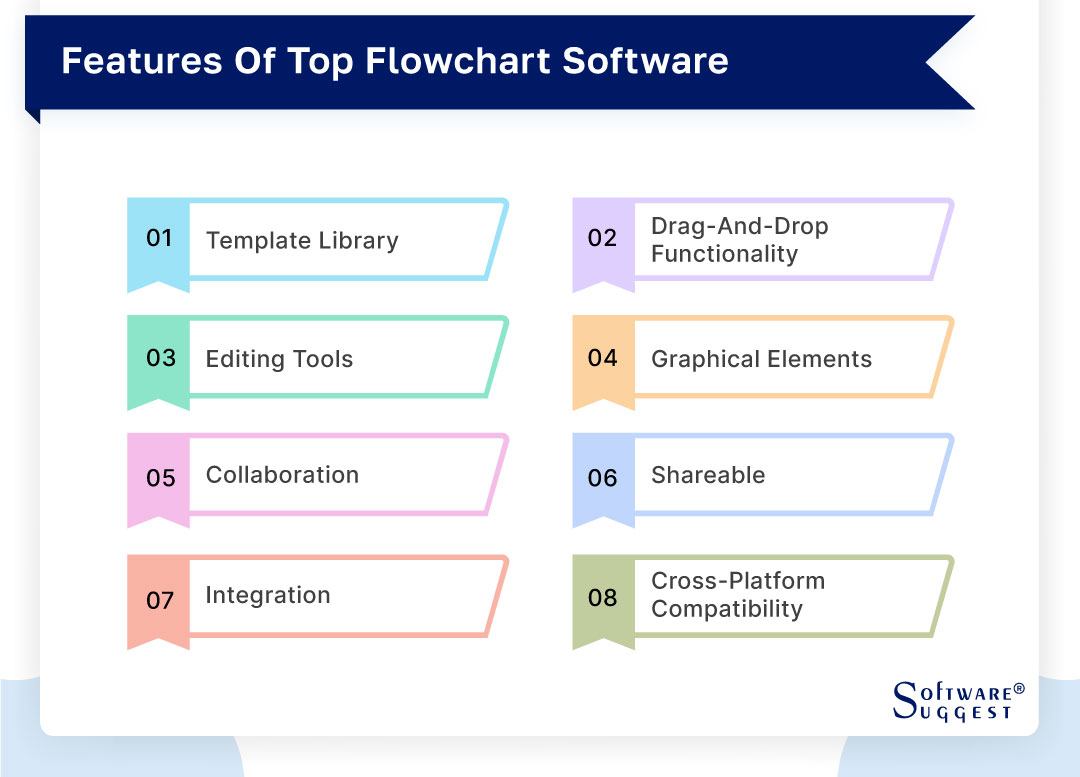
Essential Features of Top Flowchart Software
Flowchart software plays a vital role in visually representing processes, systems, and workflows clearly and structured. These applications are designed to simplify the creation and sharing of flowcharts, making them an essential tool for professionals across various domains. This description will explore the essential features that distinguish reliable flowchart software from others.
-
Template Library
An excellent flowchart software comes equipped with a diverse library of pre-designed templates. These templates cater to different types of flowcharts, including process flows, organizational charts, data flow diagrams, and more. Having a template library saves users time and effort, allowing them to choose a relevant starting point for their diagram.
-
Drag-and-Drop Functionality
Flowchart software should offer intuitive drag-and-drop functionality. Users can effortlessly add shapes, symbols, and connectors to the canvas by simply dragging them from the library and dropping them in place. This user-friendly feature streamlines the diagramming process, making it accessible to users of all skill levels.
-
Editing Tools
To create professional-looking flowcharts, robust editing tools are essential. The software should provide options to resize shapes, adjust colors and fonts, align and distribute elements, and add text annotations. Comprehensive editing capabilities empower users to customize the flowchart to their specific needs and preferences.
-
Graphical Elements
An extensive collection of graphical elements is a key feature of flowchart software. This includes various shapes, symbols, icons, arrows, and connectors that help convey specific meanings in the diagram. The software's library should be versatile enough to cover a wide range of industries and diagramming needs.
-
Collaboration
Modern flowchart software facilitates real-time collaboration among team members. Multiple users can work on the same flowchart simultaneously, enabling seamless communication and cooperation. Collaboration features enhance productivity and ensure that all stakeholders have a say in the diagram's development.
-
Shareable
The ability to share flowcharts easily is vital for effective communication and presentation. Flowchart software should offer options to share diagrams directly with others through email or generated links. Ideally, sharing options should also allow users to control viewing or editing permissions.
-
Integration
Integration capabilities are essential for seamless workflow management. Flowchart software that integrates with popular cloud storage services (e.g., Google Drive, Dropbox, OneDrive) ensures easy access to diagrams and facilitates automatic backups. Integration with other productivity tools can further streamline workflow processes.
-
Cross-Platform Compatibility
In today's multi-device world, cross-platform compatibility is crucial. A reliable flowchart software should work smoothly on various operating systems and devices, including Windows, macOS, Linux, and mobile platforms (iOS and Android). This ensures users can access and work on their diagrams from anywhere, using their preferred device.
How to Select the Right Flowchart Software?
Selecting the right flowchart software is crucial for creating professional and effective diagrams that cater to your specific needs. With numerous options available in the market, it's essential to consider several factors to ensure the software aligns with your requirements. In this description, we will explore each point to help you make an informed decision when choosing the ideal flowchart software.
-
Identify Your Requirements
Begin by understanding your flowcharting needs and objectives. Determine the types of flowcharts you'll be creating, such as process flows, data flow diagrams, organizational charts, or other specific diagrams. Consider whether you need advanced features for complex projects or a simpler tool for basic flowcharting tasks.
-
User Interface (UI)
An intuitive and user-friendly interface is essential for a smooth diagramming experience. Look for software with a well-designed and clutter-free UI that allows you to access tools and features easily. A user-friendly UI ensures that you can focus on the creative process rather than struggling with the software's interface.
-
Usability and Functionality
The software's usability and functionality should align with your skill level and diagramming requirements. Advanced users may need more sophisticated features, while beginners may prefer a tool that is easy to learn and use. Consider the availability of drag-and-drop functionality, shape libraries, and editing tools that suit your proficiency.
-
Collaboration Features
If you'll be working with a team or want to share your diagrams with colleagues or clients, collaboration features are crucial. Look for software that offers real-time collaboration, allowing multiple users to work on the same flowchart simultaneously. Collaboration features enhance communication and streamline project development.
-
Integrations Capabilities
Check if the flowchart software integrates with other tools or platforms you use regularly. Integration with cloud storage services (e.g., Google Drive, Dropbox) allows easy access to your diagrams, while integration with productivity tools enhances workflow efficiency.
-
Check Exporting and Sharing
Ensure that the software allows exporting diagrams in multiple formats such as PDF, PNG, JPEG, or SVG. This flexibility ensures that you can share your flowcharts with others or embed them in various documents or presentations without any compatibility issues.
-
Trial and Evaluate
Before committing to a flowchart software, take advantage of free trials or demos. Test the software's features and functionalities to see how well it meets your needs. A trial period allows you to evaluate whether the software aligns with your workflow and if it is comfortable to use.
-
Budget and Pricing
Consider the software's pricing and licensing models in relation to your budget. Some flowchart software may be available as one-time purchases, while others may require a subscription. Determine whether the cost is justifiable based on the software's features and benefits for your specific diagramming needs.
Top 5 Flowchart Software Comparison
|
Name
|
Free Trial
|
Demo
|
Pricing
|
|---|---|---|---|
|
7 Days |
Yes |
Starting price at $7.95/user/month | |
|
30 Days |
Yes |
Starting price at $8/member/month |
|
|
14 Days |
Yes |
Starting price at $5/user/month |
|
|
14 Days |
Yes |
Starting price at $10/Editor/Month |
|
|
30 Days |
Yes |
On Request |
Flowchart software plays a vital role in visually representing processes, workflows, and systems, making it an essential tool for professionals across various industries. With the market offering numerous options, selecting the right software can be challenging. In this list, we present the top five flowchart software known for their features, usability, and versatility, empowering users to create clear and effective diagrams.
1. Lucidchart
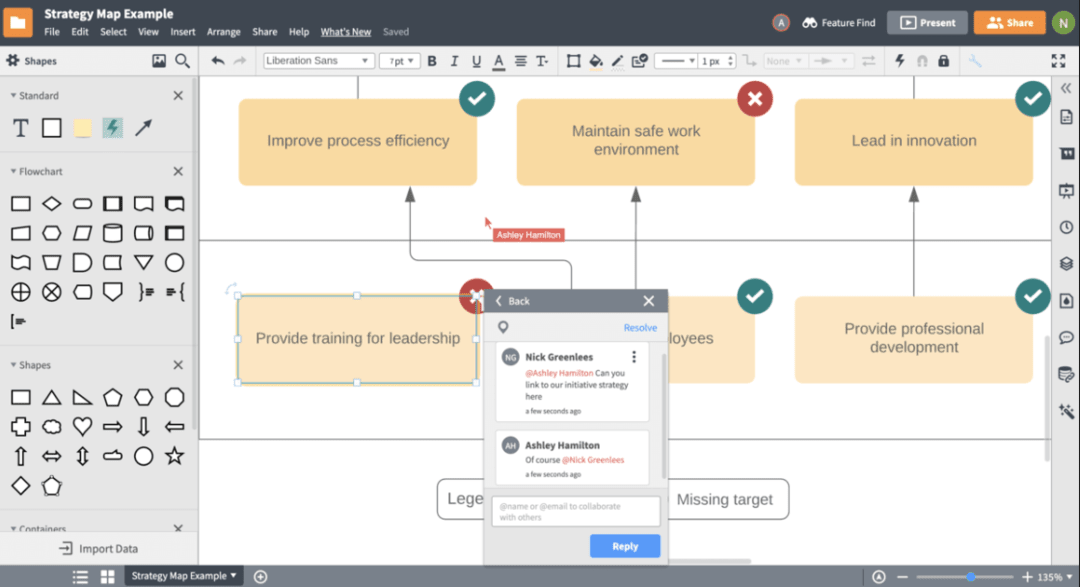
Lucidchart is a powerful and user-friendly flowchart software designed to help users create, collaborate, and visualize complex processes and ideas. Users may quickly create flowcharts, diagrams, and other visual representations with a professional appearance because of its user-friendly interface and a large library of shapes and templates.
The program is perfect for both internal and external teams because of its cloud-based platform, which enables smooth real-time communication and lets numerous team members work on the same project from different locations. Additionally, Lucidchart has numerous productivity tool integrations, making it a flexible supplement to any workflow.
- Intuitive interface
- Extensive shape library
- Real-time collaboration
- Version Control
- Integration and compatibility
- Data linking
- Customizable styles
- Collaborative comments
- Revision history
- Cross-platform accessibility
- Export and import options
- The software helps in mapping out processes and workflows.
- The software allows the whole enterprise to see how each process interacts with the other departments.
- The software points out areas of opportunity between each process.
- It eliminates unneeded steps in each process.
- The software helps the new hires to understand the process and areas that they are going to help with.
- The software should have integration options with office products.
- The software should be providing better performance for larger diagrams.
- Data linking and formulas require re-creation sometimes.
- The software should add more timeline flexibility.
Pricing
- Free
- Individual: $7.95
- Team: $9/per user
- Enterprise: On Request
2. Miro
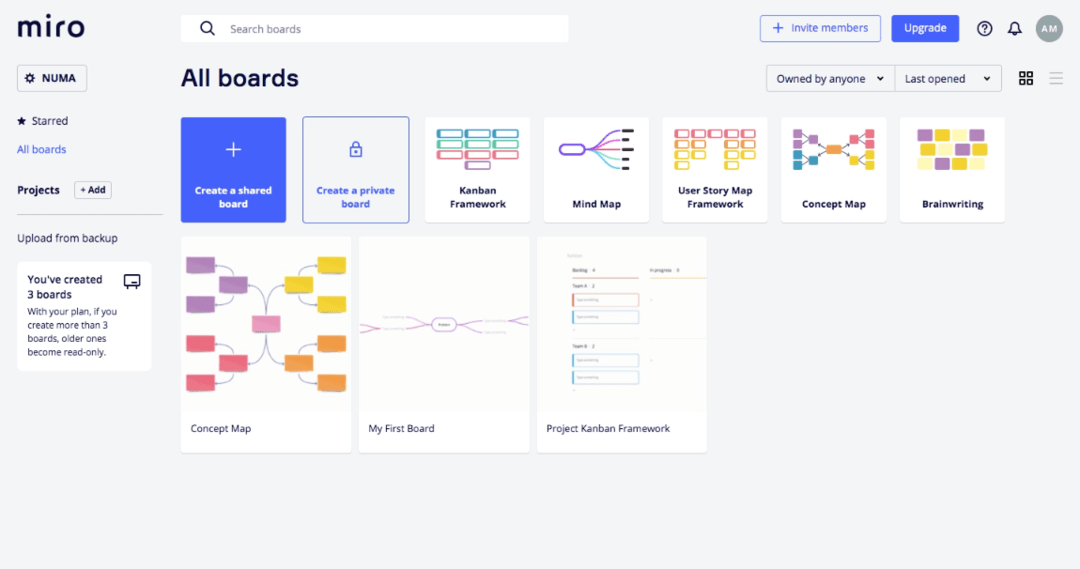
Miro is a collaborative online whiteboarding platform that enables teams to work together visually and ideate in real-time. Formerly known as RealtimeBoard, Miro provides an interactive digital canvas where users can create and collaborate on a wide range of visual content, including diagrams, mind maps, flowcharts, wireframes, and more.
The platform's intuitive interface and vast library of templates and shapes make it easy for teams to quickly start brainstorming, planning, and organizing ideas. With real-time collaboration features, team members can collaborate remotely, contributing to boards simultaneously and engaging in discussions through comments and video conferencing. Miro also integrates with various popular tools, allowing seamless workflows
- Digital whiteboard
- Collaborative real-time editing
- Wide range of templates
- Versatile visual elements
- Integration with popular tools
- Real-time communication
- User permissions and security
- Automated backups and version history
- Remote work collaboration
- Mobile app support
- Real-time voting and prioritization
- Zoomable canvas
- The software has plenty of space to create many prototypes.
- It is a centralized platform for collaboration.
- Miro is great at visualization, as it's basically a digital board with stickies and notes.
- The software helps in laying out a roadmap or strategy for an innovation workshop or program.
- The software can include templates that can allow better business process notation and modeling.
- The software should include more templates in general.
- The software should make it easier to share the final visual with others in a way that comes out nicely.
Pricing
- Free
- Starter: $8 Per member/month billed annually or $10 billed monthly.
- Business: $16 Per member/month billed annually or $20 billed monthly.
- Enterprise: On Request
3. Creately
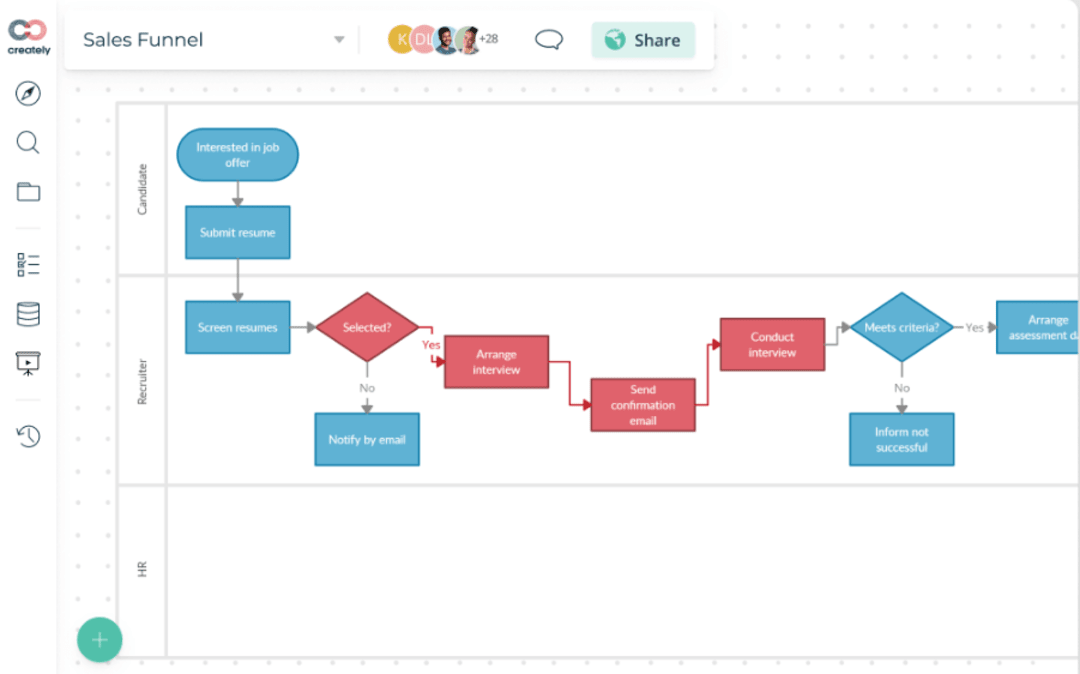
Creately is a versatile and user-friendly flowchart software designed to simplify the process of creating visual diagrams, charts, and flowcharts. With its intuitive drag-and-drop interface, Creately allows users to easily design and collaborate on various types of diagrams, from simple flowcharts to complex organizational charts and mind maps.
The software offers an extensive library of pre-built shapes, symbols, and templates that cater to different industries and diagramming needs, saving users time and effort in creating their visual representations. Additionally, Creately supports real-time collaboration, enabling multiple team members to work together simultaneously on the same diagram, regardless of their geographical location.
- Infinite visual canvas
- Real-time collaboration
- Custom databases
- Data-driven docs
- Professional diagramming
- Project & task management
- Enterprise scalability
- Powerful visual modelling
- Workflow management
- Horizontal flowchart template
- Offboarding process
- The software helps in connecting and centralizing work items from multiple apps.
- The software provides a feature for team collaboration while accessing the Kanban boards.
- The software has a huge library of templates makes the work easier for teams.
- The software provides great templates to browse.
- The software can add more tutorials to guide the users in the tool.
- The software also gets stuck sometimes when an Undo functionality is used.
- The fonts are limited.
Pricing
- Free
- Starter: $ 5 /month per user
- Business: $ 89/month
- Enterprise: On Request
4. Whimsical
Whimsical is a popular flowchart software that excels in simplifying the process of creating visual diagrams and flowcharts. With its whimsical and intuitive user interface, the platform allows users to effortlessly design various types of diagrams, from simple flowcharts to complex wireframes and mind maps. One of Whimsical's standout features is its extensive library of pre-built shapes and templates, catering to different industries and diagramming needs.
This collection empowers users to quickly bring their ideas to life without the need for extensive design skills. Real-time collaboration is a key aspect of Whimsical, enabling multiple team members to work together on the same diagram simultaneously, enhancing teamwork and productivity. Users can seamlessly share ideas, provide feedback, and collectively refine their visual representation.
- Extensive library
- Collaborative editing
- Customizable styling
- Smart connectors
- Export and sharing
- Web-based access
- Integrations
- Revision history
- Flowcharts
- The software has a great ability to share.
- The software visualizes process flows.
- It also allows for comments and feedback.
- The software enable collaboration in designing diagrams.
- The customization of colors would be improved in the software.
- Would be great if we had the ability to make the notes smaller.
- The software has limited design capabilities for more detailed wireframing.
Pricing
- Starter: Free
- Pro: $10 Per Editor / Month
- Organization: $20 Per Editor / Month
5. Draw.io
Draw.io is a user-friendly and versatile online diagramming tool that allows users to create and collaborate on a wide range of diagrams and charts. With an intuitive interface and a vast library of shapes and icons, it enables users to design flowcharts, mind maps, org charts, network diagrams, and more. Draw.io's cloud-based platform supports real-time collaboration, making it ideal for teams working together on visual projects.
It also offers the option to work offline and export diagrams in various formats, ensuring convenience and flexibility for users. Whether used for professional or educational purposes, Draw.io provides a convenient and powerful solution for visualizing ideas and concepts.
- Offline editing
- Vast library of shapes and icons
- Integrate diagrams with other software
- Collaborate in Real-Time
- Diagram editor
- Advanced tools
- Version history
- Responsive design
- The drag-and-drop feature of visuals makes it easy and fast to create diagrams and flowcharts.
- It is very convenient and simple to connect the visuals from one point to another from different sides of the visuals.
- It offers so many different visuals, flowcharts, and network diagrams.
- Draw.io can connect with Google Drive and save the work over there.
- Draw.io can improve on importing some file types.
- Draw.io should launch its desktop application for PCs and Mac.
- There are no proper tutorials and technical support services on Draw.io.
Pricing
- On Request
What Is the Cost of Flowchart Software?
The cost of flowchart software varies depending on the specific tool and its features. Some flowchart software options are available for free, offering basic functionality and limited access to templates and collaboration features.
On the other hand, premium flowchart software typically involves a subscription-based pricing model or a one-time purchase. The pricing can range from a few dollars per month for individual users to higher monthly or annual fees for team or business plans. Enterprise-level solutions with advanced features may come with higher costs. It is essential to consider the software's features, usability, and the number of users when evaluating the cost of flowchart software.
Conclusion
In conclusion, flowchart software offers a versatile and efficient solution for transforming abstract concepts into easily understandable diagrams. Its user-friendly features, collaboration capabilities, and integration options make it an indispensable asset for individuals and teams seeking to streamline their workflow and communicate ideas effectively.
Whether used for project planning, process analysis, or problem-solving, flowchart software empowers users to present complex information in a visually appealing and coherent manner, making it an essential tool in the modern professional toolkit.
FAQs
To add your flowchart to Google Docs or Sheets, first, ensure that your flowchart is saved in a compatible file format, such as PNG or JPEG. Next, open your Google Docs or Sheets document, then go to the "Insert" menu and select "Image." Choose the option to upload the flowchart from your computer or directly from Google Drive.
Once uploaded, the flowchart will be inserted into your document or spreadsheet, and you can resize or position it as needed to fit your content. This straightforward process allows you to seamlessly integrate your flowchart into your Google Docs or Sheets, enhancing your presentations, reports, or collaborative documents.
To add swimlanes or containers to your flowchart, use a flowchart software that supports this feature. Start by selecting the shape or container option that represents a swimlane from the library. Then, drag and drop the swimlane onto your flowchart canvas. Position it accordingly, and resize it as needed to accommodate the content.
Repeat the process to add multiple swimlanes, each representing different divisions or departments. Swimlanes help organize the flowchart by grouping related steps or processes together, making it easier to understand complex workflows and visualize interactions between different entities.
Standard flowchart symbols and notations are essential for ensuring clear and consistent communication in flowchart diagrams. Some common flowchart symbols include:
- Terminator (Start/End):
- Process
- Decision
- Data/Input/Output
- Connector/Arrow
- Delay
- Document
- Predefined Process
Using these standard flowchart symbols and notations ensures that your diagrams are easily understood by others, promoting effective communication and analysis of processes or workflows.