Best Gantt Chart Software
Best Gantt chart software includes Wrike, monday.com, ProjectManager, RedBooth, and GanttPRO. These Gantt chart tools allow project managers and industry leaders to plan, manage, and track work across multiple teams and help organizations meet their goals.


No Cost Personal Advisor
List of 20 Best Gantt Chart Software
Contenders | 2024
Powerful collaboration tool for teams of all sizes
Wrike is one of the best Gantt chart builders that nullifies the complexities of making Gantt charts. It offers an easy-to-use drag-and-drop feature to schedule and track your tasks in detail. Wrike also offers some core features to set and control timelines, dependencies, milestones, baselines, tasks and subtasks, risk and priorities, critical paths, etc. Read Wrike Reviews
Explore various Wrike features, compare the pricing plans, and unlock the potential of seamless operations by selecting the right software for your business.
Features
View all Wrike Features- For Software
- For Manufacturers
- Issue Scheduling
- For Sales
- For Healthcare Facilities
- Multi-Platform
- Diagramming
- Request Management
Pricing
Wrike Caters to
- StartUps
- SMBs
- Agencies
- Enterprises
Emergents | 2024
Turn possibilities into plans
FigJam empowers teams to build better products, together. Define ideas, align on decisions, and move work forward—all in one place. Whether you’re breaking the ice or planning a project, FigJam has all of the integrations, widgets, and plugins your team needs. Learn more about FigJam
Explore various FigJam features, compare the pricing plans, and unlock the potential of seamless operations by selecting the right software for your business.
Features
View all FigJam Features- Access control
- Agenda Management
- Animation
- Application Integration
- Administrator Level Control
FigJam Caters to
- StartUps
- SMBs
- Agencies
- Enterprises
Contenders | 2024
Software by Lucid Software
Lucidchart is a leading Gantt chart software for improving processes and visualizing technical systems. The powerful software offers a user-friendly interface with a drag-and-drop tool for building Gantt Charts in just a few clicks. You can also import your tasks and projects to manage your timelines effectively. Read Lucidchart Reviews
Explore various Lucidchart features, compare the pricing plans, and unlock the potential of seamless operations by selecting the right software for your business.
Features
View all Lucidchart Features- Roadmapping
- Project Planning
- Presentation Tools
- Diagramming
- Flowchart
- Templates
Pricing
Lucidchart Caters to
- StartUps
- SMBs
- Agencies
- Enterprises
Category Champions | 2024
A project management software you'll enjoy using
monday.com is a great software for making project management a breeze. It is visual and flexible, with various Gantt chart tools for creating charts that help plan, execute, and track your projects efficiently. monday.com also lets you import files from Excel, allowing you to put our work in context and collaborate with your entire team. Read monday.com Reviews
Explore various monday.com features, compare the pricing plans, and unlock the potential of seamless operations by selecting the right software for your business.
Features
View all monday.com Features- Field Sales Management
- For Sales
- Event Calendar
- Assignment Management
- Procurement Management
- Functions / Calculations
- Inventory control
- Inventory Management
Pricing
Individual
$ 0
Life Time
Basic
$ 12
Seat/Month
Standard
$ 14
Seat/Month
monday.com Caters to
- StartUps
- SMBs
- Agencies
- Enterprises
Contenders | 2024
ProofHub helps you to manage projects of all sizes
Proofhub Gantt chart project management software simplifies project management and helps teams meet deadlines. It offers easy-to-use Gantt tools to visualize, plan, and schedule tasks and timelines. Proofhub lets you set timelines, track dependencies, and identify roadblocks quickly to help you deliver ahead of time. Read ProofHub Reviews
Explore various ProofHub features, compare the pricing plans, and unlock the potential of seamless operations by selecting the right software for your business.
Features
View all ProofHub Features- Accounting Integration
- Workflow Management
- Project Planning
- File Sharing
- Status Tracking
- Time Tracking
- Portfolio Management
- Task Management
Pricing
Essential
$ 50
Per Month
Ultimate Control
$ 99
Per Month
ProofHub Caters to
- StartUps
- SMBs
- Agencies
- Enterprises
Emergents | 2024
Gantt Charts made easy
Instagantt is the best Gantt chart software that empowers project managers and teams to visualize projects and schedule tasks and resources efficiently. It is an intuitive, affordable, and simple Gantt chart maker with features like drag and drop, Kanban Board view, workload management, dashboard, analytics, and reporting. Learn more about Instagantt
Explore various Instagantt features, compare the pricing plans, and unlock the potential of seamless operations by selecting the right software for your business.
Features
View all Instagantt Features- Budget Management
- Percent-Complete Tracking
- Project Planning
- Data Imports/Exports
- Project Budgeting
- Task Management
Instagantt Caters to
- StartUps
- SMBs
- Agencies
- Enterprises
Emergents | 2024
Software by TeamGantt
TeamGantt is a free and easy project management software. It offers a simple interface and drag-and-drop scheduling, enabling you to build a project Gantt chart in minutes. TeamGantt also provides easy collaboration features, portfolio views and reports, and calendar lists and views to help you save time and hit deadlines. Read TeamGantt Reviews
Explore various TeamGantt features, compare the pricing plans, and unlock the potential of seamless operations by selecting the right software for your business.
Features
View all TeamGantt Features- Accounting Integration
- File Sharing
- Workflow Management
- Task Management
- Time Tracking
- Reporting
- Filtered Search
- Project Planning
Pricing
Free
$ 0
Per Month
Standard
$ 25
User/Month
Advanced
$ 30
User/Month
TeamGantt Caters to
- StartUps
- SMBs
- Agencies
- Enterprises
Category Champions | 2024
Gantt chart software for project management
GanttPRO is a versatile and powerful Gantt software that helps you build Gantt charts that take your projects to the next level. It helps you plan, track, and control multiple projects by splitting them into groups of tasks, subtasks, and milestones. GanttPro also helps set accurate estimates and manage resources effectively. Read GanttPRO Reviews
Explore various GanttPRO features, compare the pricing plans, and unlock the potential of seamless operations by selecting the right software for your business.
Features
View all GanttPRO Features- Project Timeline
- Resource Management
- Workload Analysis
- Scheduling
- Milestones
- Milestone Tracking
- Task Management
- File Sharing
Pricing
Basic
$ 8
User/Month Billed Annually
PRO
$ 13
User/Month Billed Annually
Business
$ 20
User/Month Billed Annually
GanttPRO Caters to
- StartUps
- SMBs
- Agencies
- Enterprises
Contenders | 2024
Software by Mango Technologies
ClickUp is an interactive online Gantt chart program that offers intuitive and easy-to-use tools for preparing Gantt charts. It allows real-time collaboration, features, and capabilities like comments, mentions, and chats for quick communication and feedback. It also lets you track dependencies and manage priorities to ensure clear project timelines. Read ClickUp Reviews
Explore various ClickUp features, compare the pricing plans, and unlock the potential of seamless operations by selecting the right software for your business.
Features
View all ClickUp Features- Task Tracking
- Task Scheduling
- Collaboration
- Time Tracking
- Gantt Charts
- Task Planning
- Recurring Tasks
- Progress Tracking
Pricing
Free
$ 0
Forever
Unlimited
$ 9
User/Month
ClickUp Caters to
- StartUps
- SMBs
- Agencies
- Enterprises
Contenders | 2024
Software by Smartsheet Inc.
SmartSheet is a simple platform that lets you view all your project information in one place. It offers the best Gantt chart tools like customizable templates, team availability, drag and drop, custom filters, and planned vs. actual timelines to help deliver projects on time. SmartSheets is ideal for various industries like project management, healthcare, marketing, construction, IT, finance, etc. Read Smartsheet Reviews
Explore various Smartsheet features, compare the pricing plans, and unlock the potential of seamless operations by selecting the right software for your business.
Features
View all Smartsheet Features- Quotes / Estimates
- Access Controls/Permissions
- Task Board View
- Drag & Drop
- Bid Management
- Goal Setting / Tracking
- Compliance Management
- Field Sales Management
Pricing
Free
$ 0
User/Month
Pro
$ 9
User/Month
Business
$ 32
User/Month
Smartsheet Caters to
- StartUps
- SMBs
- Agencies
- Enterprises
Category Champions | 2024
Conquer chaos. Exceed expectations.
This project management tool offers a free Gantt chart maker that visually represents your project progress. Zoho Project enables you to establish dependencies, reschedule tasks, highlight critical tasks, and manage timetables, all of which help you plan, track, and complete your projects more effectively. You can make each project successful with Zoho Project's improved planning and visibility. Read Zoho Projects Reviews
Explore various Zoho Projects features, compare the pricing plans, and unlock the potential of seamless operations by selecting the right software for your business.
Features
View all Zoho Projects Features- Process/Workflow Automation
- Version Control
- Email Integration
- Project Templates
- Timeline Bar Chart
- Bulk Uploading
- Color Coding
- Kanban Board
Pricing
Free
$ 0
Up to 3 users
Premium
$ 4
User/Month, Billed Annually
Enterprise
$ 9
User/Month, Billed Annually
Zoho Projects Caters to
- StartUps
- SMBs
- Agencies
- Enterprises
Contenders | 2024
Software by Paymo
Paymo offers an innovative online Gantt chart program that helps your team plan and monitor projects seamlessly. It allows you to plan, schedule, and display your project on a visual timeline by clearly showing project progress and identifying bottlenecks early on. You can also share your project progress with your clients as a PDF/PNG to keep them in the loop. Read Paymo Reviews
Explore various Paymo features, compare the pricing plans, and unlock the potential of seamless operations by selecting the right software for your business.
Features
View all Paymo Features- Budget Management
- Task Management
- Time Tracking
- Workflow Management
- Portfolio Management
- Project Planning
- File Sharing
- Gantt Charts
Pricing
Basic
$ 5
User/Month
Business
$ 12
User/Month
Professional
$ 25
User/Month
Paymo Caters to
- StartUps
- SMBs
- Agencies
- Enterprises
Contenders | 2024
Manage Your Projects Effectively and Efficiently
ProjectManager is the best Gantt software that enables users to create Gantt charts effortlessly. It helps project managers and team members plan and track projects, create schedules, allocate resources, and monitor progress. ProjectManager is a perfect solution for project management in all types of teams, including IT, construction, marketing, engineering, architecture, manufacturing, product development, etc. Read ProjectManager Reviews
Explore various ProjectManager features, compare the pricing plans, and unlock the potential of seamless operations by selecting the right software for your business.
Features
View all ProjectManager Features- Collaboration
- Email Tracking
- Time Tracking
- Budget Management
- Cross Platform
- Requirements Management
- Dashboard
- Milestone Tracking
Pricing
Business
$ 25
User/Month
Team
$ 20
User/Month
Personal
$ 15
User/Month
ProjectManager Caters to
- StartUps
- SMBs
- Agencies
- Enterprises
Category Champions | 2024
Software by Trello Inc
Trello is the best Gantt chart tool for project management. This simple, flexible, and powerful software helps teams succeed with lists and cards for task assignments, timelines, productivity metrics, calendars, etc. Trello also helps automate workflows so that your team can focus on what matters. Read Trello Reviews
Explore various Trello features, compare the pricing plans, and unlock the potential of seamless operations by selecting the right software for your business.
Features
View all Trello Features- Percent-Complete Tracking
- Time Tracking
- Gantt Charts
- Collaboration
- Progress Tracking
Pricing
Free
$ 0
Forever
Business Class
$ 10
User/Month
Enterprise
$ 21
User/Month
Trello Caters to
- StartUps
- SMBs
- Agencies
- Enterprises
Category Champions | 2024
Free Project Management Tool
Asana empowers teams to plan, execute, and track projects in one place. It is the best Gantt tool for building Gantt charts that provide a timeline to stay on schedule so you can always hit your deadlines. With Asana, you can also modify plans according to the work progress and shift deadlines to keep your project on track. Read Asana Reviews
Explore various Asana features, compare the pricing plans, and unlock the potential of seamless operations by selecting the right software for your business.
Features
View all Asana Features- Agile Methodologies
- Task Management
- Portfolio Management
- Project Budgeting
- Document Comparison
- Email Integration
- Prioritization
- Accounting Integration
Pricing
Free
$ 0
User/Month
Premium
$ 8
User/Month
Asana Caters to
- StartUps
- SMBs
- Agencies
- Enterprises
Contenders | 2024
Project Management Software
EasyProject is a Gantt chart software for easy project planning and management. It offers visualization of project tasks, drag and drop for task planning, baseline creation, and easy export and sharing features for project managers and teams of all sizes. EasyProject also facilitates real-time collaboration with team members and stakeholders to keep them updated about the project's progress. Read Easy Projects Reviews
Explore various Easy Projects features, compare the pricing plans, and unlock the potential of seamless operations by selecting the right software for your business.
Features
View all Easy Projects Features- Task Planning
- Project Scheduling
- Budget Management
- Percent-Complete Tracking
- Project Accounting
- Billable Hours Tracking
- Recurring Tasks
- Gantt/Timeline View
Easy Projects Caters to
- StartUps
- SMBs
- Agencies
- Enterprises
Contenders | 2024
Software by Bitrix Inc.
Bitrix24 is a comprehensive Gantt software designed to simplify project management. It provides a user-friendly interface and rich capabilities to build Gantt charts for efficient project management and collaboration. Bitrix24 is a valuable tool for project managers and teams of businesses of all sizes and industries. Read Bitrix24 Reviews
Explore various Bitrix24 features, compare the pricing plans, and unlock the potential of seamless operations by selecting the right software for your business.
Features
View all Bitrix24 Features- Scheduling
- Territory Management
- Lead Generation
- Email Templates
- Contact Management
- Case Management
- CRM Analytics
- Opportunity Management
Pricing
Free
$ 0
User/Month
Plus
$ 39
Unlimited user/Month
Standard
$ 99
Unlimited user/Month
Bitrix24 Caters to
- StartUps
- SMBs
- Agencies
- Enterprises
Contenders | 2024
Software by Teamwork
TeamWork is the best Gantt chart construction software to track and measure the project journey. This online Gantt chart maker maps your work and helps you visualize project timelines. Moreover, its centralized project communication keeps your team and stakeholders on the same page. No matter what changes come your way, TeamWork can update your Gantt chart planner in real-time. Read Teamwork Reviews
Explore various Teamwork features, compare the pricing plans, and unlock the potential of seamless operations by selecting the right software for your business.
Features
View all Teamwork Features- Time & Expense Tracking
- Traditional Methodologies
- Customizable Templates
- Billing & Invoicing
- Document Storage
- Activity Dashboard
- Help Desk Management
- Workflow Management
Pricing
Free
$ 0
User/Month
Starter
$ 9
User/Month, Billed Annually
Deliver
$ 14
User/Month, Billed Annually
Teamwork Caters to
- StartUps
- SMBs
- Agencies
- Enterprises
Emergents | 2024
Software by Tom's Planner
Tom's Planner is a simple yet powerful online Gantt chart software for creating and sharing professional Gantt charts quickly and effortlessly. This flexible software helps plan, visualize, and manage projects easily with Gantt charts that let you define task dependencies, milestones, constraints, baselines, and more, allowing you to see the overall picture of your project. Learn more about Tom's Planner
Explore various Tom's Planner features, compare the pricing plans, and unlock the potential of seamless operations by selecting the right software for your business.
Features
View all Tom's Planner Features- Project Planning
- Task Management
- Gantt Charts
- Reporting
- Dashboard
- Resource Management
- Team Collaboration
- Project Timeline
Pricing
Free
$ 0
Forever
Professional
$ 10
Per Month
Unlimited
$ 20
Per Month
Tom's Planner Caters to
- StartUps
- SMBs
- Agencies
- Enterprises
Contenders | 2024
Software by Redbooth
Redbooth is a modern Gantt software that makes project planning hassle-free with easy-to-use Gantt charts. Redbooth's timeline view can help set task durations, create dependencies, update changes, get overdue indicators, and more. It also provides a historical record for viewing tasks you have accomplished already. Read Redbooth Reviews
Explore various Redbooth features, compare the pricing plans, and unlock the potential of seamless operations by selecting the right software for your business.
Features
View all Redbooth Features- Gantt Charts
- Time Tracking
- Application Integration
- Email Integration
- File Sharing
- Resource Management
- Project Planning
- Task Management
Pricing
PRO
$ 5
User/Month
BUSINESS
$ 15
User/ Month
Redbooth Caters to
- StartUps
- SMBs
- Agencies
- Enterprises
Get Free Expert Advice

Recent Review
A powerful Gantt chart software helps a project manager plan, track, and manage projects, estimate delivery dates and the budget, and see the impact of ongoing changes on the whole project in one place.
This guide will talk about the importance of Gantt chart software, how to choose the best Gantt chart software, the features of Gantt software, and the top 5 Gantt chart tools to help you make an informed decision for your organization.
What is Gantt Chart Software?
A Gantt chart software is a project planning and scheduling tool that helps you visualize the actual work completed over a period of time in relation to the work planned over a period of time.
The purpose of the Gantt chart is to create an impeccable project schedule so that a project can be completed on time.
A Gantt chart typically includes two sections: the y-axis on the left that outlines a list of tasks in a project and the x-axis on the right that shows a timeline with schedule bars to visualize work.
The typical element of a Gantt chart includes tasks, timelines, dependencies, and milestones.
-
Tasks: All the tasks in a project are listed in a vertical column on the y-axis. It provides complete information on tasks such as progress status, assignee, and start & end date.
-
Timeline: A timeline allows you to visualize the progress of tasks on the project timeline. Tasks are represented as horizontal bars in the timeline on the x-axis.
-
Dependencies: It talks about how one task is connected to another. Lines or arrows on the chart depict the dependencies between tasks.
-
Milestones: Diamonds or stars are used to represent milestones. A milestone shows an important point in a project.
In a nutshell, a Gantt chart program provides you with a complete overview of the project to help you know exactly what’s going on in the project, when work is due, and who is doing which tasks.
What are the Benefits of Gantt Chart Tools?
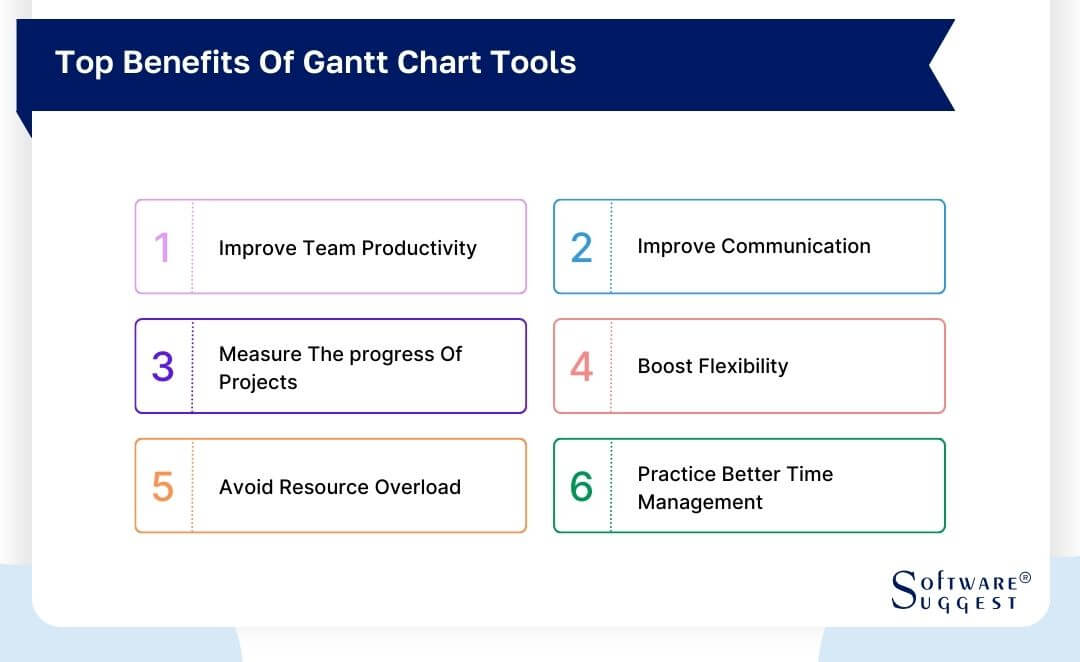
The primary purpose of a Gantt chart project management software is to plan projects and track work progress against the set plan. This results in a wide range of benefits due to enhanced visibility and a detailed overview of a project. Have a look at the key benefits of using Gantt chart tools for project management.
-
Improve Team Productivity
Gantt chart clearly defines the roles and responsibilities of every team member and the start and end date of each task. This provides clarity to the team members who are working on what. The detailed information and streamlined workflow allow teams to work efficiently and collaborate better resulting in improved productivity.
-
Improve Communication
Gantt chart software brings all the project information to a centralized and transparent place. All the project stakeholders, a project manager, and team members can see the project details, timelines, dependencies, and ongoing changes at a common centralized point. This fosters better communication and eliminates the chances of misunderstanding.
-
Measure the Progress of Projects
Gantt charts allow you to compare the actual work completed with the work planned over a period of time. This helps you measure the project progress at any point in a project and make decisions accordingly. You can easily find out whether or not the project is on schedule.
If not, you can adjust the due dates or allocate resources accordingly to complete projects on time. Apart from that, it also helps stakeholders gain an understanding of the work progress.
-
Boost Flexibility
Gantt chart project management software is used to manage projects with dependent relationships, external influences, and many moving parts. It boosts flexibility by providing you with a clear view of how one change can impact the overall progress of a task. Thus, you can easily make changes to task dates, set dependencies, and allocate resources accordingly to respond to change effectively.
-
Avoid Resource Overload
Gantt chart software provides you with a bird’s eye view of all the tasks and resources allocated to each task. You can clearly see the workload on each resource and the task schedule of each resource. If a team member is overburdened or not available leading to too many concurrent tasks, you can distribute the work or resources accordingly for effective resource planning.
-
Practice Better Time Management
Gantt chart software provides a clear depiction of tasks on a timeline. Thus, every team member has a clear idea of the start and end date of tasks and the dependencies between tasks. This helps them in better task prioritization and time management. Team members can see how their tasks impact the timeline of the project and focus first on the most critical tasks to the project's timeline and success.
What are the Features of Best Gantt Chart Software?
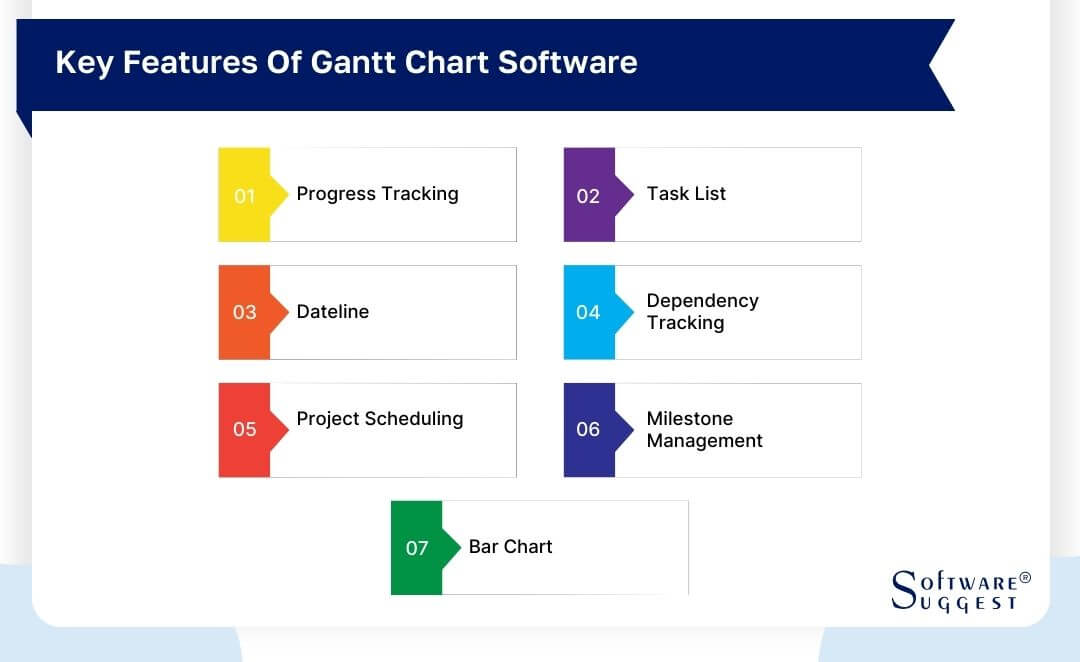
The best Gantt chart software allows you to create a project schedule, keep track of tasks, manage resources, perform predictive analysis, and collaborate with team members effortlessly in a single place. Certain core Gantt chart features make Gantt chart software powerful and easy to use.
-
Progress Tracking
There is no Gantt chart software without a timeline for progress tracking. A timeline runs horizontally on the x-axis and shows the months, weeks, days, and years. It helps track the progress of the tasks by comparing the real-time status of the task to the time planned.
-
Task List
A task list is another main component of a Gantt chart that includes all the information related to tasks. It is a vertical column on the y-axis that includes all the tasks. A task list can have multiple columns or subgroups that include all the information required to complete a task, such as assignee, priority, and status, and help keep a Gantt chart organized.
-
Dateline
Dateline is a vertical line that highlights the current date on the Gantt chart. It makes it easy to navigate and read the chart. Some Gantt chart tools allow you to auto-adjust the dateline so that it adjusts to today’s date every time you open the chart.
-
Dependency Tracking
You see the lines or arrows connecting the different bars. These are used to set and demonstrate the dependencies between tasks. You can simply draw the lines by clicking and dragging the cursor from one bar to another to set task dependencies.
-
Project Scheduling
A Gantt chart should allow you to create a roadmap for the project, create, edit & delete tasks, set task priorities & dependencies, identify the critical path, add milestones, and assign tasks to team members to create a project schedule. This provides team members with all the information required to complete a task.
-
Milestone Management
A milestone allows you to mark a crucial point in a project. It is usually represented as a diamond or star on the Gantt chart. Milestone planning involves finding the critical points in a project and adding milestones so that the team understands key deliverables, activities, or phases. Gantt software should allow you to add and plan milestones.
-
Bar Chart
A bar chart represents a task on the timeline. It is primarily used to demonstrate the progress of the task usually by bar shading or displaying the percentage of work. It also shows you the details of task duration, start and end dates, and more.
How to Choose the Right Gantt Chart Software?
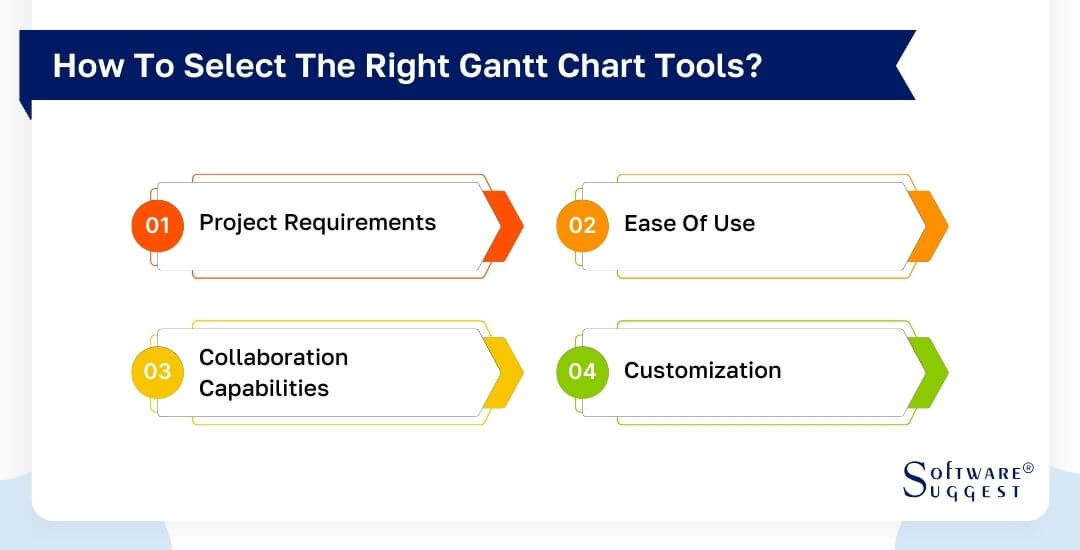
There are numerous Gantt chart tools available. To choose the right Gantt chart tool, it is very important that you ask the right questions. It will help you find the best Gantt software that fulfills your project needs or work requirements. Here are a few tips:
-
Project Requirements
First of all, define why you are using the Gantt chart and what you need it for. If you need Gantt for complex project planning, you should look for in-built features like critical path analysis and task dependencies.
On the other hand, if you need a Gantt for project cost forecasting and invoicing, you should look for a Gantt that can run project estimates, create work reports, track time logged, and create invoices for billable hours.
Create a list of features and functionalities you need to fulfill your project requirements.
-
Ease of Use
Earlier versions of Gantt chart software were hard to use. But now, Gantt charts have evolved a lot. A good Gantt chart should be easy to use and come with a user-friendly interface.
For example, you should be able to drag and drop the tasks to change the start and end dates of tasks. Similarly, setting dependencies between tasks by drawing a line is one of the most desired features of top Gantt chart software.
-
Collaboration Capabilities
A Gantt chart tool should have powerful collaboration capabilities so that multiple team members can work together productively. Simultaneous editing of a chart by multiple team members, tracking edits, adding comments, attaching files, and sharing the chart are some of the important collaboration features you need to look for in online Gantt chart software.
-
Customization
Most companies using Gantt chart software for project planning also use it for work management. Customization capabilities such as custom fields, custom columns, and custom roles make it easy to manage and track work using Gantt.
For example, the ability to customize the Gantt by the team members to visualize the task schedule and progress makes it easy for a project manager to check status updates. Look for a customizable Gantt chart tool.
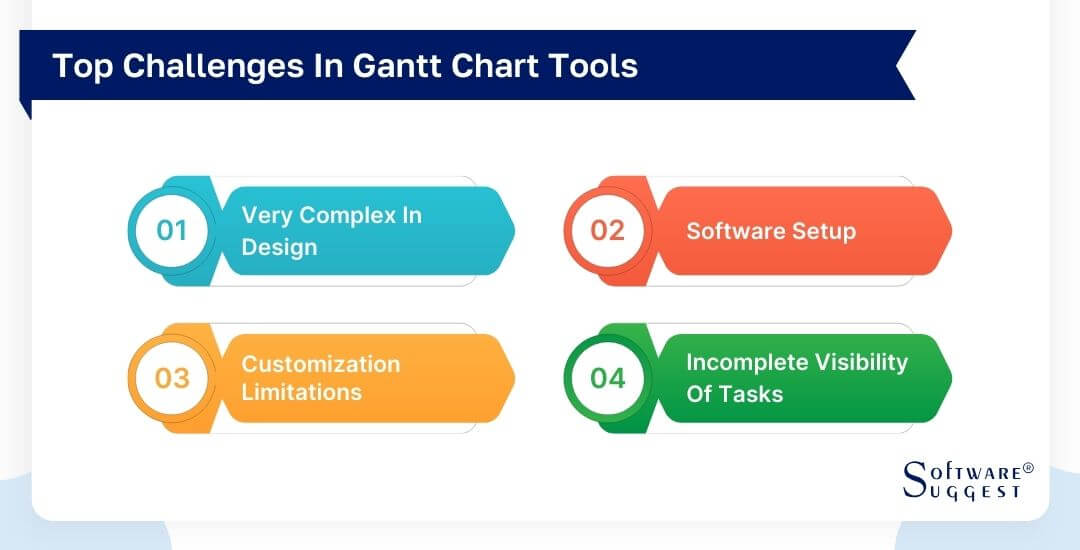
What are the Challenges Faced in Gantt Chart Tools?
Gantt chart software is great for project planning and scheduling, but due to the very design and framework, even the best Gantt tool poses a series of challenges. Have a look at some of the commonly faced challenges in Gantt chart tools.
-
Very complex in design
Gantt charts by design are complex. It takes time for beginners to understand and learn to use Gantt charts. Especially, if you are using a basic Gantt chart program, it is hard to read. One can easily get confused due to plenty of information about tasks, subtasks, & dependencies, and end up misreading the details.
However, modern-day Gantt chart tools make it easy to read Gantt charts with colorful bars and a user-intuitive interface.
-
Setup
One of the biggest challenges of using Gantt chart software is it requires a lot of information upfront to set it up. You need to add task details, determine task dependencies, set milestones, allocate resources, highlight the most critical task, add constraints, and input other project-specific information to use a Gantt chart effectively. This requires extensive knowledge of a Gantt tool on how to perform each action.
-
Customization Limitations
Modern-day Gantt chart tools have evolved a lot, but it does not provide the level of customization other project management tools offer. For example, if you want to make changes in the project plan to accommodate changing requirements, it gets really difficult to make changes as you have to reschedule the entire plan. Gantt chart is a good tool to manage projects with fixed project requirements such as the construction of a house.
-
Incomplete visibility of tasks
Gantt software is primarily a project planning tool. It connects one task to another and shows how they are dependent on each other. And when you add information on subtasks and set dependencies, the Gantt chart easily gets overloaded and complex. Due to limited visibility on screen, it gets difficult to visualize the progress at a glance. Something, you can easily do with Kanban.
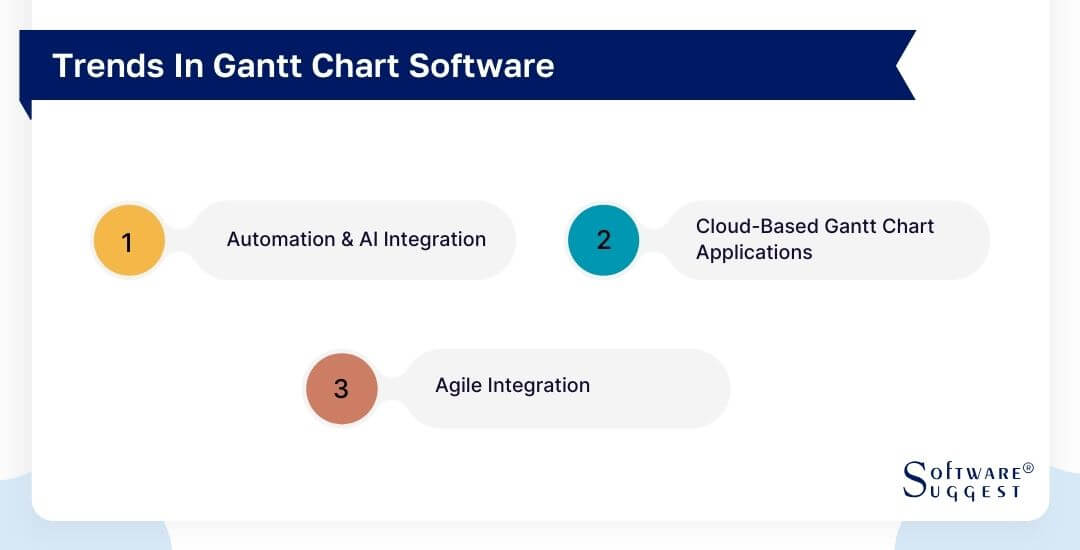
Market Trends in Online Gantt Chart Software
Gantt chart has been in existence for over 100 years, and it is probably one of the oldest planning tools. It has its own share of disadvantages due to the very times it is developed in. However, the advent of technologies and market dynamics have changed Gantt charts a lot to adapt to current working requirements. Here are the key latest trends Gantt chart software is witnessing.
-
Automation and AI Integration
AI and Machine learning have changed the Gantt charts a lot. It has made the Gantt chart software more useful and accurate. For example, you can perform better risk analysis of your project roadmap based on historical data and predictive analysis. It will help you create a risk-proof project plan.
Similarly, AI can provide you with in-depth insights for resource optimization and workflow automation makes it easy to create project roadmaps in less time with minimal effort.
-
Cloud-based Gantt chart applications
Cloud-based Gantt chart applications are witnessing a huge rise in popularity because now multiple team members can use the Gantt chart simultaneously from anywhere. There is no need to export and share the Gantt chart, make edits, and then again share the Gantt chart. Users with an internet connection can access their cloud-based Gantt charts from anywhere, on any device.
-
Agile Integration
Gantt charts are ideally designed to adapt to fixed working environments, but agile teams are making use of the Gantt chart where they need to set dependencies and perform work in sequential workflow. Gantt charts have become a valuable tool in breaking down large tasks into smaller tasks, setting dependencies, and facilitating collaboration in Agile environments.
Conclusion
Gantt chart software is a great project planning, scheduling, and management tool that provides you a great control over project management. Especially, when you are working on large and complex projects with dependent relationships and many moving parts, it allows you to break projects into easily manageable small tasks, set task dependencies, estimate project delivery, forecast project costs, and create a detailed roadmap.
By investing in the right tool, you can ensure that you work with a team efficiently, control the project better, and make sure that you complete the project within budget and time.
FAQs
You can create a Gantt chart in Microsoft Project Excel for free by following a series of steps. Here is a brief explanation:
- Open Excel and Select the data you want to chart
- Click Insert > Insert Bar Chart > Stacked Bar chart
- Format the stacked bar chart to appear like a Gantt chart
- Customize the chart
- Save the Excel file.
Generally, most of the cloud-based Gantt chart software meets industry-standard security requirements. There are no concerns related to security. However, it is always a good idea to check the security compliance of the SAAS software you are using.
Gantt chart software is available from free to very expensive. But you can expect a cost range of $5-$45 per user per month. The cost of Gantt chart software depends on multiple things such as features, team size, cloud or premise, and security.
By Industries