
About Sisense:
Sisense, headquartered in New York, is a Business Intelligence solution, designed to make analysis simpler by transforming complex data to visuals. With the detailed visuals, businesses can make informed decisions. Sisense lets you connect various data, even from multiple sources, to creates visual representation like graphs, charts etc. to analyze the data in a simpler way.
What’s Good in Sisense:
- The software is visually appealing. The creation of visuals from data is outstanding!
- You can connect data from different sources. That will be an awesome tool for the companies with tons of data with different sources.
- The process of converting data to analysis is very fast!
- Multiple visualization techniques to represent the data like bar chart, pie chart, line chart, area chart, column chart etc.
- Creates an entire dashboard of the data. So, you can have a lot of information in graphical form on a single screen.
- The prepared dashboards can be saved in pdf format.
What Can be Improved:
- It would have been more convenient if the modules for data preparation (Elasticube Manager) and analysis be on the same platform.
- The tool is a bit complicated to understand. As a user, you might be needing few tutorials to understand.
Full Sisense Review:
As a software reviewer, I constantly look out for tools that can simplify the complex tasks, and one such example is Sisense. Sisense lets you convert various complex data to visual representation so that you can make informed logical decisions.
Elasticube Manager:
Elasticube manager is a space where one can prepare the data for the analysis. In this module, you can prepare data for analysis from various sources. Suppose, I have two different sources of data, but both the data have interconnection. It would be very tough for a user to combine both the data manually to carry out analysis. But with Sisense, you can connect various data, irrespective of its source. Have a look:
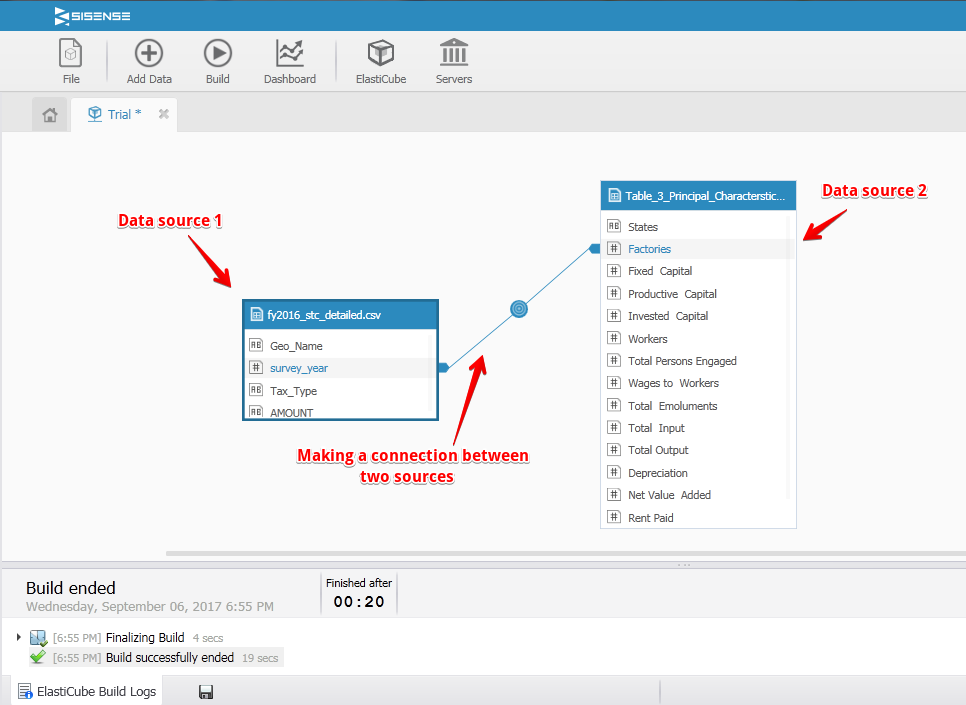
Elasticube manager is basically a platform to create food for the analysis. By connecting different data sources, you can make a fused data which can be used for the analysis. You can add data in various formats like Excel file, CSV format, through database servers or directly from various web services like Google Analytics. Here I have taken two data sources and made up a connection with each other.
Dashboard:

The data created in Elastic Manager will be used in the SaaS module. Here dashboard will directly lead you to upload the data and start the analysis.
By taking the previous example: I have a list of States of United States of America, and amount of taxes collected. Within the same data, I have much information such as type of tax, survey year etc. Here I can select the various widgets which user wants for the analysis. For ex: States and Tax amount collected. Sisense allows the user to create various kinds of charts like bar charts, area chart, column chart, pie charts etc. The user can create various charts by selecting various widgets like:
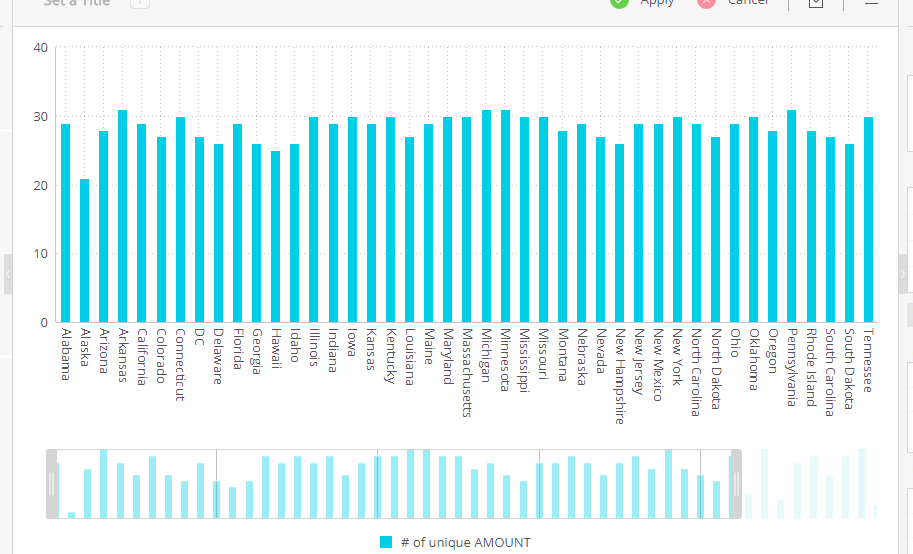
By creating various charts for same datasets, a user can create an entire dashboard which will give various graphical representation on a single screen! You can access the dashboard via mobile app & web, and you can download the dashboard in pdf format as well. Have a look:

Bottom line:
As a BI software user, you will find it extremely easy to combine complicated data sets and make graphical representation of various kinds. By using In-Chip engine, Sisense will serve you analysis material within few seconds. Although, I do think both these modules (Elasticube Manager & Analysis dashboard) should be in the same place. But, Sisense does make it extremely easy when you have multiple data sources.
As a business, Sisense is a great tool to analyze your business activities which are generally distributed in various channels. You can bring all these information sources at one platform and make analysis way simpler!
SoftwareSuggest empowers businesses to discover top business software and service partners. Our software experts list, review, compare and offer a free consultation to help businesses find the right software and service solutions as per their requirement. We have helped 500,000+ businesses get the right software and services globally. Get a free consultation today!


