What is Grapheme?

Grapheme is an intuitive and powerful data visualisation and statistical analysis tool with first in class analysis tools, including six-sigma capabilities, design of experiments, response surfaces and classification algorithms.

Pricing

Grapheme Starting Price

$ 50/Per Year

Awards
Grapheme Award

Our Awards and Recognition

More Awards
Need a Little Help?

Talk with a software expert for free. Get a list of software that's great for you in less than 10 minutes.

Key Features of Grapheme

Here are the powerful features that make Grapheme stand out from the competition. Packed with innovative tools and advanced functionalities, this software offers a range of benefits.

  • AI Governance
  • Annotations
  • Artificial Intelligence
  • Boolean Queries
  • Campaign Management
  • Channel Management
  • Collaboration
  • Content Management
  • Contextual Search
  • Conversion Tracking
  • Dashboard
  • Dashboard Creation
  • Data Analysis
  • Data Classification
  • Data Discovery
  • Data filtering
  • Data Management
  • Data Matching
  • Data Mining
  • Data Quality Control
  • Data Science
  • Data Source Integrations
  • Data Visualization
  • Data warehousing
  • Document Filtering
  • Email / Online
  • Event Triggered Actions
  • Filtered Views
  • For Education
  • For Healthcare
  • For Mobile
  • For Websites
  • Functions / Calculations
  • Graphical Data Presentation
  • Heatmaps
  • High Volume Processing
  • Interactive
  • Job Scheduling
  • Keyword Tracking
  • KPIs
  • Language Detection
  • Machine Learning
  • Machine Learning as a Service
  • Match & Merge
  • Media Analytics
  • Metadata Management
  • Mixed Methods Research
  • MLOps
  • Model Training
  • Modeling & Simulation
  • Multi-Campaign
  • Multi-Language
  • Multiple Site Management
  • Non-Relational Transformations
  • Pageview Tracking
  • Panel Management
  • Performance Metrics
  • Predictive Analytics
  • Predictive Modeling
  • Private Dashboards
  • Public Dashboards
  • Qualitative Comparative Analysis
  • Quantitative Content Analysis
  • Referral Source Tracking
  • Regression Analysis
  • ROI Tracking
  • Sample Management
  • Scorecards
  • Screen Activity Recording
  • Self Service Data Preparation
  • Sentiment Analysis
  • Site Search Tracking
  • Statistical Analysis
  • Statistical Modeling
  • Summarization
  • Survey Management
  • Tagging
  • Taxonomy Classification
  • Templates
  • Text Analysis
  • Text Analytics
  • Time on Site Tracking
  • Topic Clustering
  • Unmoderated Testing
  • Usability Testing
  • User Interaction Tracking
  • User Journeys
  • User Research
  • User Research Analysis
  • Visual Analytics
  • Visual Discovery
  • Visualization
  • Widgets
  • Workload Analysis
Show More
  • Audit Management
  • Complaint Management
  • and list reporting
  • Administrator Level Control
  • Air Management
  • Alerts Notifications
  • Analytics
  • Archiving & Retention
  • Assignment Management
  • Audit Management
  • Audit Trail
  • Auditing
  • Automated Routing
  • Automated Scheduling
  • Backlog Management
  • Batch Records
  • Bills of Material
  • Budgeting & Forecasting
  • Bug Tracking
  • Calibration Management
  • CAPA Planning
  • Capacity Planning
  • Change Management
  • Change Orders
  • Collaboration
  • Commenting / Notes
  • Complaint Management
  • Compliance Management
  • Components Tracking
  • Contract Management
  • Controls Testing
  • Corrective / Preventive Actions
  • Corrective Actions (CAPA)
  • Corrective and Preventive Actions (CAPA)
  • Cost-to-Completion Tracking
  • CRM
  • Customer Complaint Tracking
  • Customer DataBase
  • Dashboard
  • Data Entry
  • Data Linking
  • Data Management
  • Defect Tracking
  • Design Management
  • Deviation Management
  • Device History
  • Device History Record
  • Document Control
  • Document Management
  • Drawings Integration
  • Due date tracking
  • Electronic Signature
  • Emissions Inventory
  • Employee Management
  • Employee Training
  • Environmental Compliance
  • Environmental Management
  • Environmental Risk Assessment
  • Equipment Management
  • Equipment Tracking
  • Escalation Management
  • Excel Loader
  • FDA Compliance
  • Feedback Management
  • Feedback Tracking
  • Filtering
  • Fixed Asset Management
  • FMEA (Failure Mode and Effects Analysis)
  • Forecasting
  • Forms Management
  • Gage Management
  • Hazardous Materials Control
  • Hierarchical View
  • HIPAA Compliance
  • Incident Management
  • Include Photos In Reports
  • Industrial Safety Management
  • Injury Reporting
  • Inspection Management
  • Inventory control
  • Inventory Management
  • Invoice Management
  • ISO Compliance
  • ISO Standards Management
  • Issue & Return Management
  • Issue Auditing
  • Issue Management
  • Issue Scheduling
  • Issue Tracking
  • Iteration Planning
  • Job Costing
  • Job Management
  • Knowledge Base Management
  • Knowledge Management
  • Labor Hours Tracking
  • Lease and Maintenance Management
  • Maintenance Management
  • Maintenance Scheduling
  • Management Review
  • Material Management
  • Measurement Readings
  • MES
  • Move & Copy
  • MRP
  • MSDS
  • Multi-Station Management
  • Nonconformance Tracking
  • Occupational Health Management
  • OPC Data Collection
  • Order Management
  • OSHA Compliance
  • OSHA Recordkeeping
  • Overrun Reporting
  • Parameterized Testing
  • Percent-Complete Tracking
  • Performance Metrics
  • Periodic Review
  • Photos In Reports
  • Point-of-Production Analysis
  • Print on Site
  • Prioritization
  • Product data management
  • Product Lifecycle Management
  • Production Cost Tracking
  • Production Management
  • Production Scheduling
  • Project Management
  • Purchase Order Management
  • Quality Assurance Management
  • Quality Control
  • Quality Control Checklist
  • Quality Management
  • Quote Management
  • Quotes / Estimates
  • Real Time Data Collection
  • Recall Management
  • Recipe Management
  • Recurring Issues
  • Regulatory Compliance
  • Release Management
  • Report Templates
  • Reporting
  • Reporting/Analytics
  • Requirements Management
  • Requirements Review
  • Requirements-Based Testing
  • Resource Management
  • Risk Alerts
  • Risk Management
  • Root Cause Analysis
  • Routing
  • Safety Management
  • Safety Risk Assessment
  • Sarbanes-Oxley Compliance
  • Scheduling
  • Shipping Management
  • Speech Recognition
  • Stakeholder Defined Attributes
  • Statistical Data Reporting
  • Status Tracking
  • Subcontractor Management
  • Supplier Management
  • Supplier Quality Control
  • Supply Chain Management
  • Supports Parallel Execution
  • Supports Agile
  • Sustainability Management
  • Task Management
  • Test Case Tracking
  • Test Script Reviews
  • Testing / QA Management
  • Testing Management
  • Ticket Management
  • Time & Expense Tracking
  • Time Tracking
  • Tool Kitting
  • Traceability
  • Traceback & Traceforward
  • Training Management
  • Unicode Compliance
  • User Level Management
  • Validation & Verification
  • Version Control
  • Waste Management
  • Water Management
  • What-if Analysis
  • Work order management
  • Workflow Management
Show More
  • Ad hoc Analysis
  • Ad Hoc Reports
  • Algorithmic trading
  • Charting
  • Compliance Management
  • Consolidation / Roll-Up
  • Content Management
  • Content Management System
  • Conversion Tracking
  • Crypto
  • Dashboard
  • Dashboard Creation
  • Data Visualization
  • Diagnostic Tools
  • Dynamic Maps
  • Filtered Views
  • Fintech
  • Full Transaction Diagnostics
  • Goal Tracking
  • Key Performance Indicators
  • Multiple Site Management
  • OLAP
  • Online Analytical Processing (OLAP)
  • Pageview Tracking
  • Performance Control
  • Presentation Tools
  • Project Planning
  • Quantitative Analysis
  • Referral Source Tracking
  • Relational Display
  • Resource Management
  • Root-Cause Diagnosis
  • Scorecarding
  • Server Performance
  • Simulation Models
  • Statistical Analysis
  • Territorial Mapping
  • Time on Site Tracking
  • User Interaction Tracking
  • Visual Discovery
Show More
  • Activity Log
  • Activity Monitoring
  • Ad hoc Analysis
  • Ad Hoc Reports
  • AI / Machine Learning
  • Analytics
  • Application Development
  • Application Security
  • Association Discovery
  • Attribution Modeling
  • Behavioral Analytics
  • Benchmarking
  • Big Data Analytics
  • Browsing History
  • Budgeting & Forecasting
  • Campaign Tracking
  • Channel Attribution
  • Collaboration
  • Compliance Tracking
  • Corrective Actions (CAPA)
  • Cross-Channel Attribution
  • Dashboard
  • Dashboard Creation
  • Data Analysis
  • Data Analysis Tools
  • Data Blending
  • Data Blends
  • Data Cleansing
  • Data Collection
  • Data Discovery
  • Data Entry
  • Data Linking
  • Data Management
  • Data Mining
  • Data Visualization
  • Data warehousing
  • Decision Tree Analysis
  • Demand Forecasting
  • Design Analysis
  • Device management
  • Email Monitoring
  • Excel Loader
  • File Storage
  • Filtered Views
  • For Education
  • For Healthcare
  • Forecasting
  • Goal Setting / Tracking
  • Graphical Modeling
  • High Volume Processing
  • Internal Controls Management
  • Key Performance Indicators
  • Keystroke Recording
  • Media Planning
  • Modeling & Simulation
  • Monte Carlo Simulation
  • Multi-Touch Attribution
  • Multivariate Analysis
  • Operational Risk Management
  • Performance Management
  • Performance Metrics
  • Point-of-Production Analysis
  • Predictive Analytics
  • Presentation Tools
  • Productivity Analysis
  • Prototyping
  • Regression Analysis
  • Regulatory Compliance
  • Remote Control
  • Risk Assessment
  • ROI Tracking
  • Sample Management
  • Screen Activity Recording
  • Sensitivity Analysis
  • Sentiment Analysis
  • Social Media Metrics
  • Spend Management
  • Statistical Analysis
  • Statistical Modeling
  • Statistical Process Control
  • Statistical Simulation
  • Supplier Quality Control
  • Survey Management
  • Survival Analysis
  • Text Analytics
  • Time & Attendance
  • Time Series
  • Time Tracking
  • Version Control
  • Visual Discovery
  • Visualization
  • Web Threat Management
  • Website Analytics
  • Whitelisting / Blacklisting
Show More

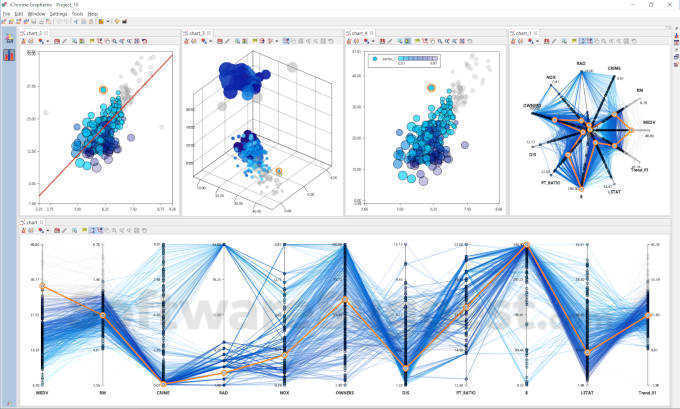
Grapheme Screenshots

Grapheme Pricing

Here are the pricing plans for Grapheme. Choose the plan that best fits your requirements and budget. Get Detailed Grapheme pricing as per your requirements.

Standard Edition
$ 50
Per Year
  • Statistical Analysis and Six Sigma
  • Design of Experiments
  • Response Surfaces and Regressions
  • Perpetual machine locked license
Get Pricing
Professional Edition
$ 400
Per Year
  • Statistical Analysis and Six Sigma
  • Design of Experiments
  • Response Surfaces and Regressions
  • SQL database connectors and data workflow
  • Machine locked perpetual license
Get Pricing

Grapheme Specifications

Get a closer look at the technical specifications and system requirements for Grapheme. Find out if it's compatible with your operating system and other software.

Deployment :
On Premises
Subscription Plan :
Yearly, Onetime(Perpetual license)
Accessibility :
API
Customization
Desktop Platforms :
Windows
Language Support :
English
Business :
Freelancers
StartUps
SMBs
Enterprises
Available Support :
Email
Training
Company Details :
Company Name : ICHROME LTD
Website : Visit Website

Grapheme Description

Here's the comprehensive description of Grapheme. Gain a brief understanding of its unique features and exceptional benefits.

Grapheme is an intuitive and powerful tool specifically designed to perform data analysis tasks such as Statistic analysis, Six-sigma, Design of Experiments, Response Surfaces, Classification and Regressions capabilities within a friendly and intuitive user graphical interface. Grapheme capabilities are organized in four main modules:

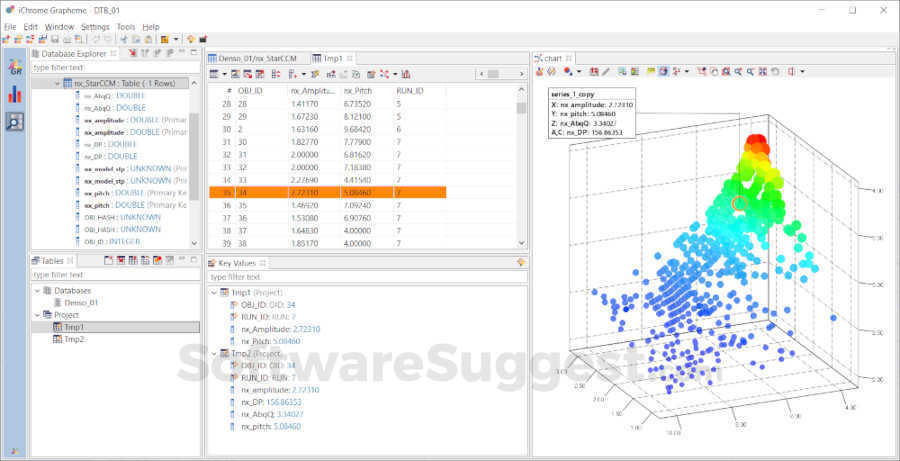
  • the Charting and Visualization module enables advanced data visualization, responsive and attractive charts specifically design to explore large set of data and to guide informed decisions and problems insight.
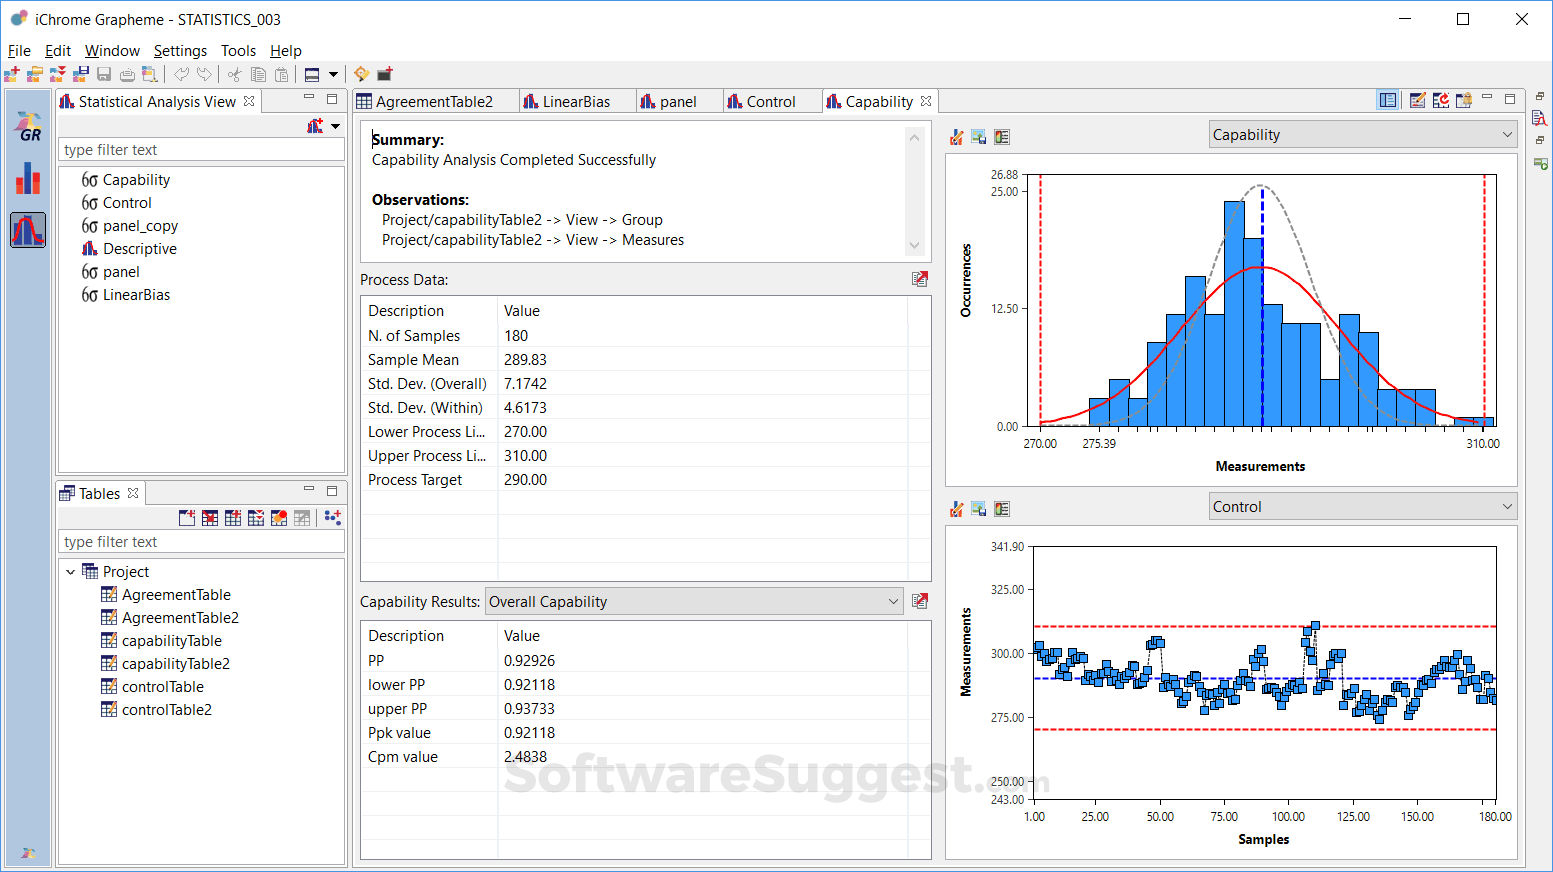
  • the Statistic and Six-Sigma Analysis module guides the user to perform Statistical Analyses moving from the data stored in the project. Descriptive Analysis, One Sample T- and Z-Test, Two Samples T-Test, Correlation Analysis, Covariance Analysis, Normality Test, Paired T-Test, One way ANOVA, One way ANOVA test and Two way ANOVA are but few examples.
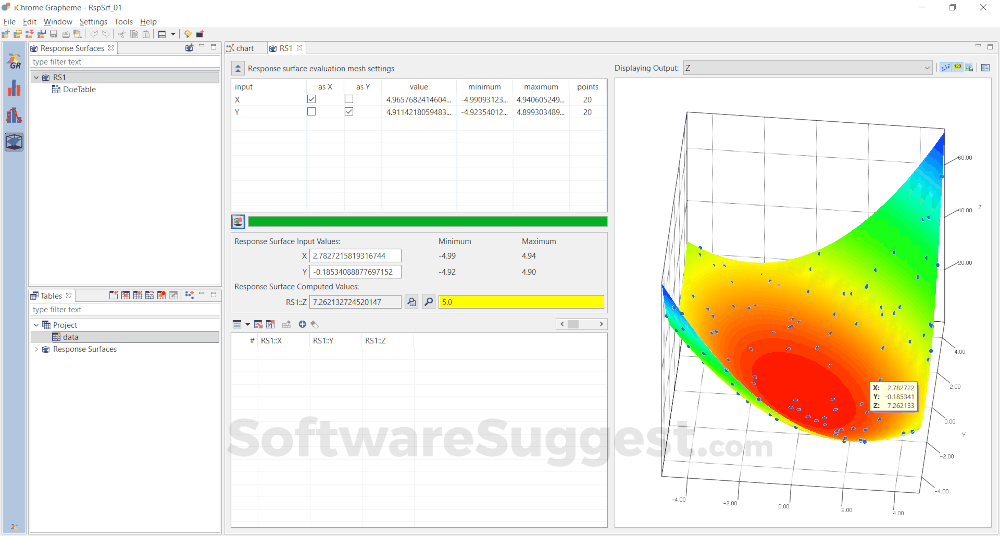
  • the Design of Experiments and Response Surfaces module helps the user to plan and execute state-of-the-art design of experiments as well as to create and validation Response Surfaces using best in class methodologies.
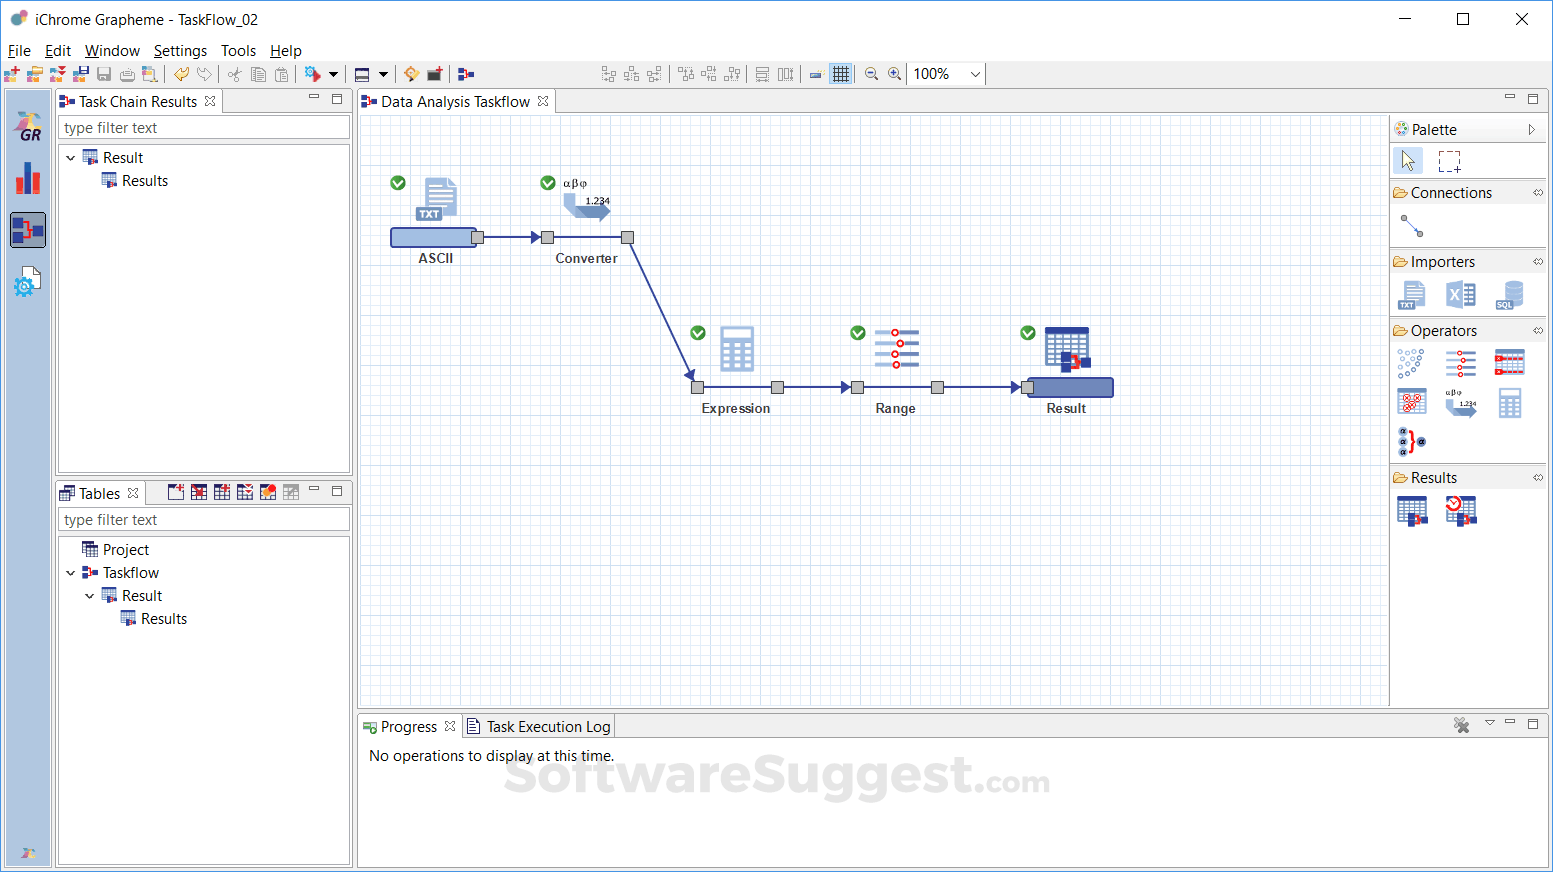
  • the Data Analysis Workflow helps user defining stream of operations on data sources to extract subset of information and manipulate data. Thanks to this chaining technology the user can visually handle complex set of data in order to extract meaningful sets of information

Grapheme Resources

Grapheme Brochures Download Brochure

Overall Grapheme Reviews

Thinking about using Grapheme? Check out verified user reviews & ratings based on Grapheme's features, user-friendliness, customer support, and other factors that contribute to its overall appeal.

5/5

Based on 4 Reviews

Write a Review Or
Ask a question
Feature Feature 5

Feature

Out of 5

Ease of use Ease of use 5

Ease of use

Out of 5

Value for money Value for money 5

Value for money

Out of 5

Customer support Customer support 5

Customer support

Out of 5

Likelihood to recommend Likelihood to recommend 0%

Likelihood to recommend

Out of 100%

Grapheme Pros and Cons

"The capability of easily display and navigate million points of data in a very short time"

"Graphical user interface is simple and very easy to use"

"The product is easy to use and quite intuitive. After trying other similar softwares, this is the best"

"I would like to use it on my mac."

"more manipulation on imported data like for example transformation of a row into a column and viceversa"

"I have not found any particular flaws in this software; every aspects of this product are easy to use"

4 Grapheme Reviews

Hear directly from customers who have used Grapheme. Read their experiences, feedback, and ratings to gain valuable insights into how this software has benefited their businesses.

Davide

Used the software for : 2+ years

Company Size :51-200 employee

5.0

Oct 05, 2020

Best Data Explorer Ever!

Our company use this tool to produce visual representations of complex data that we show to our customers. It's absolutely necessary for us to graphically represent complex data and this tool is exactly what I need to explains our search results.

Feature Feature 5

Feature

Out of 5

Ease of use Ease of use 5

Ease of use

Out of 5

Value for money Value for money 5

Value for money

Out of 5

Customer support Customer support 5

Customer support

Out of 5

Grapheme Mobile App Experience

1 2 3 4 5 6 7 8 9 10

Grapheme After Sales Service Rating

1 2 3 4 5 6 7 8 9 10

What do you like best about Grapheme?

The capability of easily display and navigate million points of data in a very short time

What do you dislike about Grapheme?

I would like to use it on my mac.

Do you think Grapheme delivers value for the money spent?

Yes

Are you satisfied with Grapheme features?

Yes

Did implimentation of Grapheme was easy?

Yes

What features is Grapheme currently missing?

No

What other products like Grapheme have you used or evaluated?

Self implemented other tools

How Grapheme is better/different from its competitors?

It's ready to use

Francescod.

Used the software for : 2+ years

Company Size :51-200 employee

5.0

Oct 01, 2020

import csv files

I import csv files and then I create graphs based upon imported data. The available 2D and 3D graphs are useful to display data in different ways. It helps me a lot on doing my analytical analysis of processed data

Feature Feature 5

Feature

Out of 5

Ease of use Ease of use 5

Ease of use

Out of 5

Value for money Value for money 5

Value for money

Out of 5

Customer support Customer support 5

Customer support

Out of 5

Grapheme Mobile App Experience

1 2 3 4 5 6 7 8 9 10

Grapheme After Sales Service Rating

1 2 3 4 5 6 7 8 9 10

What do you like best about Grapheme?

Graphical user interface is simple and very easy to use

What do you dislike about Grapheme?

more manipulation on imported data like for example transformation of a row into a column and viceversa

Do you think Grapheme delivers value for the money spent?

Yes

Are you satisfied with Grapheme features?

Yes

Did implimentation of Grapheme was easy?

Yes

What features is Grapheme currently missing?

nothing in mind at the moment

Sìservicess.

Used the software for : 2+ years

Company Size :51-200 employee

5.0

Oct 01, 2020

Usability

This software is easy to use and the interface is user friendly. In a few clicks I got the expected results. From the graphic point of view, nothing to say; in one screen, all the results are under control

Feature Feature 5

Feature

Out of 5

Ease of use Ease of use 5

Ease of use

Out of 5

Value for money Value for money 5

Value for money

Out of 5

Customer support Customer support 5

Customer support

Out of 5

Grapheme Mobile App Experience

1 2 3 4 5 6 7 8 9 10

Grapheme After Sales Service Rating

1 2 3 4 5 6 7 8 9 10

What do you like best about Grapheme?

The product is easy to use and quite intuitive. After trying other similar softwares, this is the best

What do you dislike about Grapheme?

I have not found any particular flaws in this software; every aspects of this product are easy to use

Do you think Grapheme delivers value for the money spent?

Yes

Are you satisfied with Grapheme features?

Yes

Did implimentation of Grapheme was easy?

Yes

What features is Grapheme currently missing?

Using Grapheme, I don't find any missing features for the use I make of it

Alberto

Used the software for : 2+ years

Company Size :51-200 employee

5.0

Oct 01, 2020

Data correlation

Grapheme allowed me to correlate a huge amount of data, before I struggled with excel filtering and formulas. Very powerful graphics. I will try to use this software also for exploring financial markets data.Thank you

Feature Feature 5

Feature

Out of 5

Ease of use Ease of use 5

Ease of use

Out of 5

Value for money Value for money 5

Value for money

Out of 5

Customer support Customer support 5

Customer support

Out of 5

Grapheme Mobile App Experience

1 2 3 4 5 6 7 8 9 10

Grapheme After Sales Service Rating

1 2 3 4 5 6 7 8 9 10

What do you like best about Grapheme?

The graphics are impressive and intuitive. Good job

What do you dislike about Grapheme?

Automatic reporting can be improved. Maybe a word template can be helpful

Do you think Grapheme delivers value for the money spent?

Yes

Are you satisfied with Grapheme features?

Yes

Did implimentation of Grapheme was easy?

Yes

What features is Grapheme currently missing?

No

Alternatives of Grapheme

Explore alternative software options that can fulfill similar requirements as Grapheme. Evaluate their features, pricing, and user feedback to find the perfect fit for your needs.

Grapheme FAQs

How much does Grapheme cost?

The starting price of Grapheme is ₹ 3600/Per Year. It has different pricing plans:

  1. Standard Edition : ₹ 3600/Per Year
  2. Professional Edition : ₹ 28800/Per Year

Grapheme also provides a free trial to users.

What are the top 5 features for Grapheme?

The top 5 features for Grapheme are:

  • Data Analysis Tools
  • Data Analysis
  • Data Visualization
  • Data Mining
  • Visual Analytics

What type of customer support is available from Grapheme?

The available support which Grapheme provides is:

  • Email
  • Training
Free Demo Get Pricing
Free Demo