Best Heatmap Software
Best heatmap software solutions include NotifyVisitors, Smartlook, SimpleHeatmaps, Vishlesan, Inspectlet, and Mouseflow. With these software solutions, businesses can take advantage of A/B testing, sales intelligence, and other exciting features to improve brand value.


No Cost Personal Advisor
List of 20 Best Heatmap Software
Category Champions | 2024
Software by Freshworks
Freshmarketer is a heat mapping software that offers many features, like heatmap visualization, A/B testing, user segmentation, etc, to optimize the user experience and engagement with the website. Its friendly and customizable user interface makes the platform easy to adapt. The information and insights offered are effective and data-driven. Read Freshmarketer Reviews
Explore various Freshmarketer features, compare the pricing plans, and unlock the potential of seamless operations by selecting the right software for your business.
Features
View all Freshmarketer Features- Campaign Segmentation
- Drag & Drop
- Search
- Workflow Management
- Landing Pages
- Scheduling
- Polls/Voting
- Email Integration
Pricing
Freshmarketer Caters to
- StartUps
- SMBs
- Agencies
- Enterprises
Contenders | 2024
Software by Wingify
VWO is one of the most advanced heat mapping software that offers detailed heatmap visualizations on how the users interacted with various webpage or application elements like links, images, buttons, etc. Areas that need to be improved can be effectively identified. All in all, it is a perfect heatmap software to make the website or apps more effective and enhance engagement. Read VWO Reviews
Explore various VWO features, compare the pricing plans, and unlock the potential of seamless operations by selecting the right software for your business.
Pricing
VWO Caters to
- StartUps
- SMBs
- Agencies
- Enterprises
Emergents | 2024
Analytics solution for SMBs and eCommerce sites
Smartlook is a heat mapping software that offers detailed analysis and insights about the visitors of the websites and their behavior. Accurate mapping of user interactions is feasible with functionalities like session replays, heatmaps, and conversion funnels to better comprehend visitors' preferences. These features make it one of the best heat mapping software. Learn more about Smartlook
Explore various Smartlook features, compare the pricing plans, and unlock the potential of seamless operations by selecting the right software for your business.
Features
View all Smartlook Features- API Monitoring
- Event Logs
- Real Time Monitoring
- Event-Based Notifications
- Root Cause Analysis
Smartlook Caters to
- StartUps
- SMBs
- Agencies
- Enterprises
Contenders | 2024
Software by Crazy Egg
Crazy Egg is a website heatmap software that offers features like heat mapping, scroll maps, confetti, overlay reports, etc., for figuring out user behavior. It tracks clicks, interactions with digital assets, visitor preferences, etc., and provides data-driven insights to developers or businesses. It is one of the finest heatmap analytics software with such advanced functionalities. Read Crazy Egg Reviews
Explore various Crazy Egg features, compare the pricing plans, and unlock the potential of seamless operations by selecting the right software for your business.
Crazy Egg Caters to
- StartUps
- SMBs
- Agencies
- Enterprises
Contenders | 2024
Powerful online solutions for all businesses
Hotjar is an analytics and heatmap software designed to assist businesses in understanding how users interact with their websites. It also provides insights on which areas can be improved to enhance engagement, conversion rate, etc. With Hotjar, businesses can elevate the user experience, and the performance of their website and applications will also improve. Read Hotjar Reviews
Explore various Hotjar features, compare the pricing plans, and unlock the potential of seamless operations by selecting the right software for your business.
Features
View all Hotjar Features- User Research Analysis
- Behavioral Mapping
- Question Branching
- Usability Testing
- Trend Analysis
- Dashboard
- Custom Survey URLs
- Customer Journey Mapping
Hotjar Caters to
- StartUps
- SMBs
- Agencies
- Enterprises
Contenders | 2024
Business optimization solution for startups and enterprises
Lucky Orange is a website heatmap software that optimizes websites by providing the owner insights on improving the user experience. It provides several features to its users, like analytics, conversion funnels, heatmaps, etc. The Heatmap feature is highly detailed and represents visitors' clicks, scrolls, and time spent on the website. Read Lucky Orange Reviews
Explore various Lucky Orange features, compare the pricing plans, and unlock the potential of seamless operations by selecting the right software for your business.
Features
View all Lucky Orange Features- User Interaction Tracking
- Time on Site Tracking
- Conversion Tracking
- Goal Tracking
- Referral Source Tracking
- Campaign Management
- Multiple Site Management
- Pageview Tracking
Pricing
Starter
$ 10
Per Month
Small Business
$ 20
Per Month
Medium
$ 50
Per Month
Lucky Orange Caters to
- StartUps
- SMBs
- Agencies
- Enterprises
Emergents | 2024
Advanced analytics software for startups/online businesses
Inspectlet is one of the best heat map software that perfectly identifies the user requirements or which product or page gets the highest clicks. So according to that trend, effective business decisions can be made. In addition, the features provided make the process more streamlined and efficient, and desired results can be achieved. Learn more about Inspectlet
Explore various Inspectlet features, compare the pricing plans, and unlock the potential of seamless operations by selecting the right software for your business.
Features
View all Inspectlet Features- Dashboard
- Behavioral Mapping
Inspectlet Caters to
- StartUps
- SMBs
- Agencies
- Enterprises
Emergents | 2024
Building the best online experience for businesses
FullStory is a heatmap software that provides accurate information on converting visitors into clients or customers by optimizing the website or application. It records each user's sessions and advanced heatmap features highlighting the most visited website or application areas. This will provide a clear picture to the owners, and they can make an informed decision. Learn more about FullStory
Explore various FullStory features, compare the pricing plans, and unlock the potential of seamless operations by selecting the right software for your business.
Features
View all FullStory Features- Trend Analysis
- Customer Segmentation
- Reports
- Dashboard
Pricing
Free
$ 0
Forever
Professional
$ 849
Per Month/Billed Annually
FullStory Caters to
- StartUps
- SMBs
- Agencies
- Enterprises
Emergents | 2024
Cloud-based bioinformatics tool for plan/biotech industries
Qlucore Omics Explorer is one of the best heat mapping software for accurately analyzing and visualizing large-sized and complex data. Its easy-to-use and interactive user interface best suits genetics, biomedical, and agriculture streams. It offers quick and precise visualization of patterns and provides the owners or researchers with comprehensible data. Learn more about Qlucore Omics Explorer
Explore various Qlucore Omics Explorer features, compare the pricing plans, and unlock the potential of seamless operations by selecting the right software for your business.
- Dynamic Maps
- For Science
- Dashboard
- Website Analytics
Qlucore Omics Explorer Caters to
- StartUps
- SMBs
- Agencies
- Enterprises
Contenders | 2024
Software by Attention Insight
Attention Insight is a heatmap software with the most advanced technology highlighting the most viewed areas of websites or applications. With this data, the organizations can optimize the websites by adding relevant data or options on the hotspots. This will lead them to increased engagement and conversion rate. Read Attention Insight Reviews
Explore various Attention Insight features, compare the pricing plans, and unlock the potential of seamless operations by selecting the right software for your business.
Features
View all Attention Insight Features- AI / Machine Learning
- Demand Forecasting
Attention Insight Caters to
- StartUps
- SMBs
- Agencies
- Enterprises
Emergents | 2024
Software by Glassbox Digital
Glassbox is one of the best heat mapping software available, as it accurately maps each visitor's interaction with the website. It calculates the clicks and the webpage on which the visitor spends the most time, and it offers the owners or host conversion funnels which will assist them in monetizing the websites or applications. Learn more about Glassbox
Explore various Glassbox features, compare the pricing plans, and unlock the potential of seamless operations by selecting the right software for your business.
Features
View all Glassbox Features- Data Mining
- Data Visualization
- High Volume Processing
- Predictive Analytics
Glassbox Caters to
- StartUps
- SMBs
- Agencies
- Enterprises
Contenders | 2024
Conversion, Usability, Heatmap, Popups, SEO
Plerdy is a heatmap analytics software that offers powerful features to optimize conversion rates, leading businesses to generate more revenue. In addition, it provides insights on how to improve the user experience, website performance, engagement, etc. Moreover, it offers advanced features such as SEO analysis, A/B testing, clicks maps, etc. Read Plerdy Reviews
Explore various Plerdy features, compare the pricing plans, and unlock the potential of seamless operations by selecting the right software for your business.
Features
View all Plerdy Features- Pageview Tracking
- Goal Tracking
- Push Notifications
- Behavioral Analytics
- Time on Site Tracking
- Campaign Tracking
- User Interaction Tracking
- Keyword Tracking
Pricing
Econom
$ 20
Per Month
Business
$ 60
Per Month
Premium
$ 100
Per Month
Plerdy Caters to
- StartUps
- SMBs
- Agencies
- Enterprises
Emergents | 2024
Software by Quantum Metric
Quantum Metric is a heat mapping software that offers real-time information concerning user experience and website performance. It operates on advanced machine-learning technology to accurately identifies the issues and suggest improvements that can be made. It also provides insights into behavioral flows, demographics, and segmentwise website or application performance. Learn more about Quantum Metric
Explore various Quantum Metric features, compare the pricing plans, and unlock the potential of seamless operations by selecting the right software for your business.
Features
View all Quantum Metric Features- Sentiment Analysis
- Dashboard
- Multi-Channel Collection
- Element Analytics
- Multiple Site Management
- Behavioral Mapping
- Keyword Tracking
- Territorial Mapping
Pricing
Free
$ 0
Premium
$ 5500
month
Quantum Metric Caters to
- StartUps
- SMBs
- Agencies
- Enterprises
Emergents | 2024
Software by Instapage Inc
Instapage is the best heatmap software for businesses, with many advanced features like drag and drop, an adaptive user interface, and easy integration with different tools. Hence, it is a one-stop solution to increase user engagement. Also, the platform is highly intuitive and records each and every movement of the visitor. Learn more about Instapage
Explore various Instapage features, compare the pricing plans, and unlock the potential of seamless operations by selecting the right software for your business.
Pricing
Free
$ 0
month
Core
$ 79
month
Optimizer
$ 129
month
Instapage Caters to
- StartUps
- SMBs
- Agencies
- Enterprises
Emergents | 2024
Software by ContentSquare
ContentSquare is a heat mapping software that aims to amplify the customer experience. Advanced analytics and data on behavior, clicks, and other relevant information will be useful for businesses to optimize their websites and applications to elevate the user experience. The platform operates on AI-powered algorithms to precisely analyze the navigation and scrolls and provide recordings of the user sessions for effective website administration. Learn more about ContentSquare
Explore various ContentSquare features, compare the pricing plans, and unlock the potential of seamless operations by selecting the right software for your business.
Features
View all ContentSquare Features- Customer Segmentation
- Action Management
- Sentiment Analysis
- Text Analysis
- Trend Analysis
ContentSquare Caters to
- StartUps
- SMBs
- Agencies
- Enterprises
Emergents | 2024
Software by uxcam
Uxcam is a heatmap tracking software that enables users to monitor how the user interacts with their websites, what they prefer, which digital products get the most clicks, etc. It also provides information about the issues that must be resolved to improve engagement and amplify the conversion rate. Learn more about Uxcam
Explore various Uxcam features, compare the pricing plans, and unlock the potential of seamless operations by selecting the right software for your business.
Features
View all Uxcam Features- Screen Activity Recording
- Usability Testing
- User Journeys
- User Research
- Heatmaps
- For Mobile
Uxcam Caters to
- StartUps
- SMBs
- Agencies
- Enterprises
Emergents | 2024
Software by Zoho Corporation Pvt. Ltd.
Zoho PageSense is a website heatmap software that assists you in optimising your website, personalising pages for your target audience, and increasing your overall conversion rate. You can exactly analyse what works on your website and what causes drop-offs using tools like Funnel Analysis, Form Analytics, Heatmap, Session Recording, A/B Testing, and Personalization, and optimise it for higher conversions. Learn more about Zoho PageSense
Explore various Zoho PageSense features, compare the pricing plans, and unlock the potential of seamless operations by selecting the right software for your business.
Features
View all Zoho PageSense Features- In-App Events Tracking
- User Interaction Tracking
- Heatmaps
- Multiple Site Management
- Behavioral Mapping
- Element Analytics
- For Websites
- Dashboard
Pricing
ANALYZE
$ 10
Per Month
ENGAGE
$ 15
Per Month
OPTIMIZE
$ 25
Per Month
Zoho PageSense Caters to
- StartUps
- SMBs
- Agencies
- Enterprises
Contenders | 2024
Marketing automation software for all online businesses
NotifyVisitors is the most intuitive heatmap software that allows users to increase engagement with the potential customers visiting the website. It offers advanced functionalities like sending personalized notifications, creating campaigns, and tracking them. It can be easily integrated with other tools like WordPress, Shopify, etc., which is advantageous for users. Read NotifyVisitors Reviews
Explore various NotifyVisitors features, compare the pricing plans, and unlock the potential of seamless operations by selecting the right software for your business.
Features
View all NotifyVisitors Features- Omnichannel
- Web Notifications
- User Journeys
- Customer Segmentation
- Mobile Notifications
- AI / Machine Learning
- Customer Journey Mapping
- Personalization
NotifyVisitors Caters to
- StartUps
- SMBs
- Agencies
- Enterprises
Emergents | 2024
Software by Roxr Software Ltd
Clicky is the best heat mapping software that monitors and records which areas of websites receive the maximum clicks. The heatmap visualization feature is easily comprehensible due to the color coding functionality where warmer colors indicate more clicks and cooler colors indicate fewer clicks. This will enable businesses to take effective decisions to optimize their websites or applications. Learn more about Clicky
Explore various Clicky features, compare the pricing plans, and unlock the potential of seamless operations by selecting the right software for your business.
Features
View all Clicky Features- Event Logs
- Performance Metrics
- Applications Management
- Uptime Reporting
- Transaction Monitoring
- API Monitoring
- Real Time Comparisons
- Real Time Monitoring
Clicky Caters to
- StartUps
- SMBs
- Agencies
- Enterprises
Emergents | 2024
Software by Microsoft Corporation
Clarity is a free and simple heatmap software that records how real people interact with your website. Setup is simple, and you'll be receiving data in minutes. Microsoft Clarity enable you to track and predict user behavior on your site. Learn more about Microsoft Clarity
Explore various Microsoft Clarity features, compare the pricing plans, and unlock the potential of seamless operations by selecting the right software for your business.
Features
View all Microsoft Clarity Features- Screen Activity Recording
- Behavioral Mapping
- In-App Events Tracking
- For Websites
- Element Analytics
- Funnel Analysis
- Multiple Site Management
- Dynamic Maps
Microsoft Clarity Caters to
- StartUps
- SMBs
- Agencies
- Enterprises
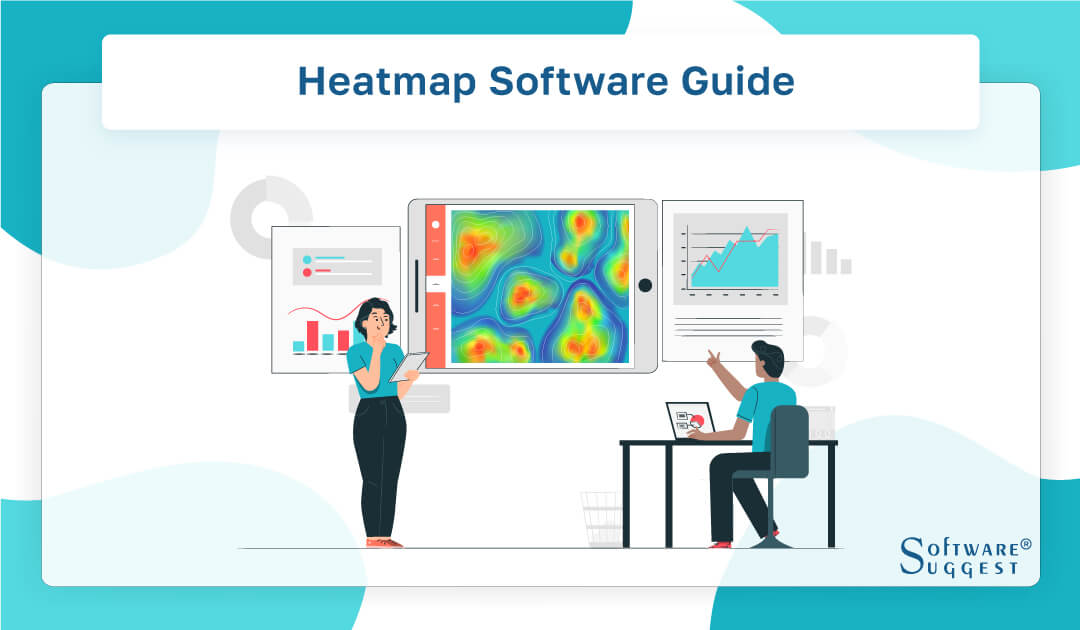
Popular data visualization tools like heatmaps make it simple to comprehend and analyze huge datasets.
They are extensively employed in many different fields, including business, healthcare, finance, and marketing. Users of heatmap tools may easily construct bespoke heatmaps and meaningfully view their data.
The market is inundated with different best heatmap tools and alternatives thanks to technological advancements. Selecting the very best heatmap tools and software for your unique needs might be challenging.
In this piece, we'll examine the best heat map software that are currently in the market in 2024.
We will take into account elements like cost-effectiveness, unique features, and data compatibility.
At the conclusion of this post, you will know more about all the tools and top heatmap solutions on the market and be able to choose the right option for your data visualization requirements.
What Is Heatmap Software?
Data visualization tools like heatmaps are frequently used to display and examine big datasets.
Heatmaps are visual displays of data where values are denoted by colors. They make it simpler for consumers to easily spot patterns and trends in data, facilitating the making of well-informed decisions.
Several businesses employ heatmap analysis, including business, healthcare, finance, and marketing. When there is a lot of data to evaluate and conventional data analysis techniques are insufficient, it is very helpful to invest in the best heatmapping software.
There are several kinds of heatmaps, such as:

-
Geographic Heatmaps
Data is displayed using geographic heatmaps, which employ location-based information. They are especially helpful for companies with a wide global reach that need to examine data from various areas.
-
Online Heatmaps
Online heatmaps are another tool for examining user activity on a website. They assist website proprietors in comprehending customer behavior on their site and locating areas that want development.
-
Time-Series Heatmaps
Time-series heatmaps are tools for examining data over time. They assist users in finding patterns and trends in data and in forecasting the future.
What Does Heat Mapping Software Do?
What can we learn from heat maps? Heat maps show us where visitors click, hover their mouse, move their eyes, and how far they scroll down. This is accomplished by averaging user behavior.
Assume you want to see how far down your website's page users scroll before clicking away. You would begin by collecting this information from every person who visits your website. This information would then be superimposed on a screenshot of your website.
Areas that heavily overlap implying that numerous visitors scrolled down to reach them, would be highlighted in red. Areas with little overlap, indicating that few users visited them, would be highlighhted in green or blue. You should definitely place your CTA in one of the red places and think about how the presence of graphic components affects user behavior.
Most web designers combine and show this data using one of the numerous analytics tools.
Benefits of Heatmap Software
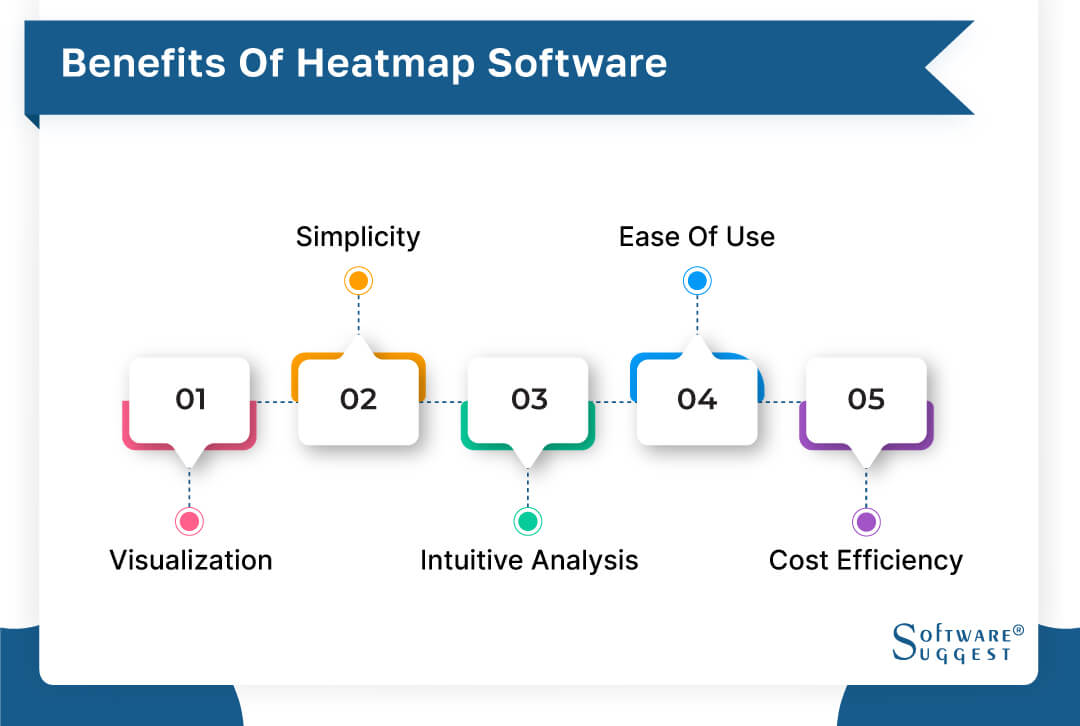
When it comes to assessing data and making judgments, heatmap software has numerous benefits that increase operational efficiency. The following are some of the benefits offered by heatmap tracking software:
-
Visualization
Users can utilize heatmap software to quickly visualize complex information, allowing them to find trends in enormous volumes of data that would otherwise be difficult or impossible to spot. This enables businesses to make more educated business decisions.
-
Simplicity
Heatmaps are relatively simple tools that may be utilized by anyone with a basic comprehension of the data being evaluated. There is no need for technical code or methods; all that is necessary is an understanding of the structure of the dataset and how it should be displayed on a heatmap.
-
Intuitive Analysis
Users can utilize heatmaps to quickly acquire insights into their data sets and analyze relationships between different factors. Humans can perceive patterns and similarities between diverse bits of information more easily when visualizations are displayed on a two-dimensional plane rather than just numerical data.
-
Ease of Use
Heatmap software is very user-friendly, allowing users to quickly become acquainted with its capabilities even if they have no prior knowledge or experience dealing with this type of application. Furthermore, most recent heatmap software packages provide built-in training and support materials to quickly get new users up and running.
-
Cost Efficiency
Finally, heatmap software saves money by eliminating the requirement for costly statistical analysis or consulting services that are generally necessary to crunch massive amounts of data. It also saves time interpreting findings because insights are clearly visible due to its intuitive visualization features.
Features Of Heatmap Software
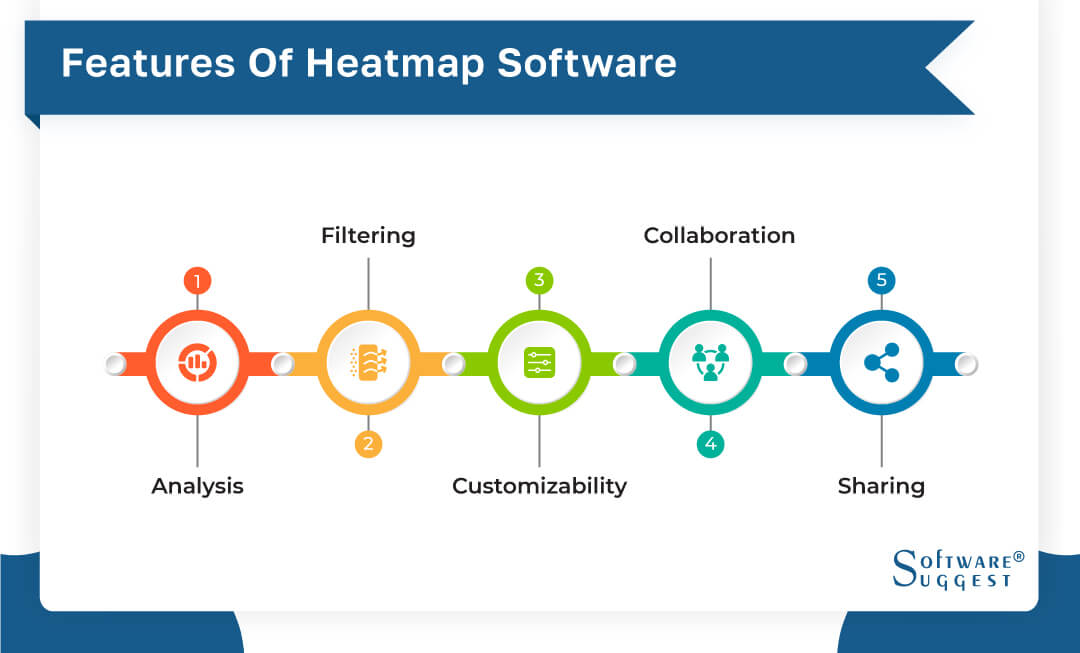
Heatmap software tools have a range of advanced features. These tools may analyze, evaluate, and comprehend big datasets with the aid of a number of attributes. Some of these features include the following:
-
Analysis
Heatmap software is intended to help in the identification of patterns and trends in data sets. It enables users to investigate correlations between variables and make informed conclusions regarding the significance of their data.
-
Filtering
Heatmap software can be used to remove irrelevant or undesired data from analysis findings. This aids in the simplification of complex datasets for easy comprehension.
-
Customizability
Users using heatmap software can modify the look and feel of their visualization by changing the colors, fonts, layout options, and other aesthetic choices.
-
Collaboration
Heatmaps can be emailed or shared online with colleagues or clients for real-time collaboration. This makes it simple to collaborate on data analysis without needing to be in the same physical area.
-
Sharing
Heatmaps can be readily exported into a variety of file types, such as PDFs or photos, and shared with others outside of the program. A heatmap can also be embedded in HTML code for website display.
How To Choose The Best Heatmap Tool?
Heatmaps are a powerful tool for visualizing complex data sets and making insights more accessible. However, with so many heatmap tools available, it can take time to choose the right one.
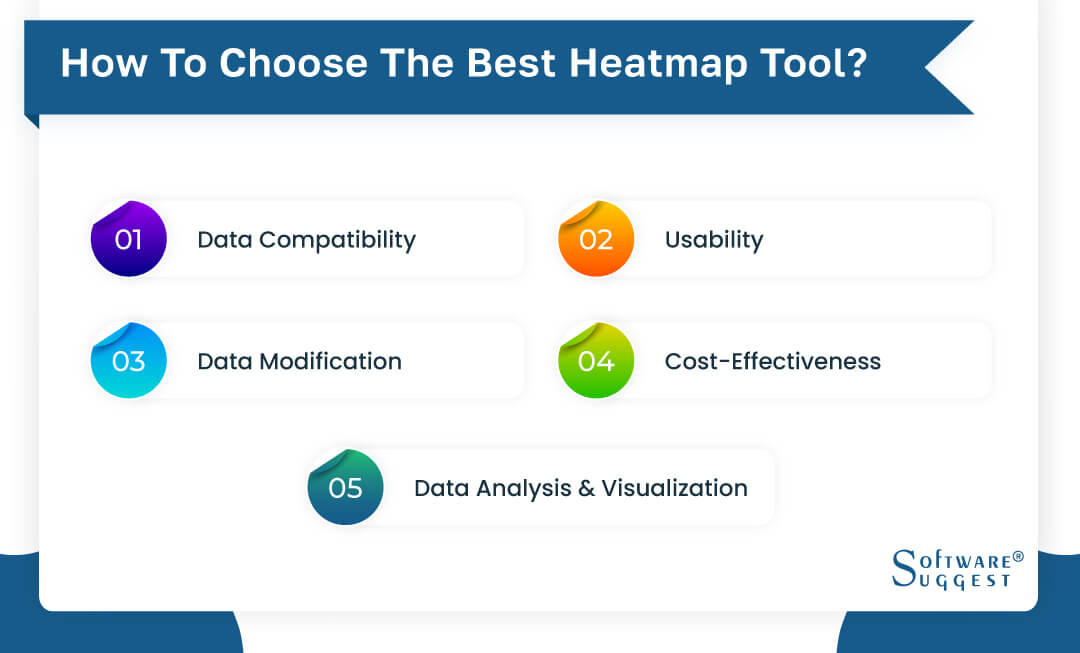
From data compatibility and usability to customization and cost-effectiveness, understanding key criteria will help you choose the best heatmap software for your data analysis needs. Here are some important parameters to keep in mind while choosing the right heatmap tool:
-
Data Compatibility
The heatmap program has to work with the data sources you are utilizing. You should be able to import and export data in a variety of formats, including CSV, Excel, and other data sources.
-
Usability
The heatmap program should have a user-friendly interface and be simple to use. To assist you in getting started, it needs to contain tutorials and clear directions.
-
Data Modification
You should be able to modify the heatmap in the heatmap program to meet your unique requirements. You should be able to alter the heatmap's color scheme, text size, and other features.
-
Data Analysis & Visualization
The functions you want for data analysis and visualization should be included in the heatmap software. Data aggregation, interactive components, collaborative tools, and real-time updates are a few examples of this.
-
Cost-Effectiveness
The cost-effectiveness and price of the heatmap should fit your budget. A monthly or yearly membership price may be required for some solutions, while others may be free.
Top 5 Heat Mapping Software Comparison
|
Name
|
Free Trial
|
Demo
|
Starting Price
|
|---|---|---|---|
| 14-days |
Yes |
Starts at $19/month | |
|
14-days |
Yes | Quotation Based | |
|
15-days |
Yes |
Starting price at $9.99 Per user/month | |
| 14-days |
Yes |
Free | |
|
14-days |
Yes |
Starting price at $29.00/month |
Heat mapping software is an invaluable resource for companies and organizations looking to evaluate user behavior and optimize their websites or apps. With so many alternatives on the market, selecting the best heat mapping software for your needs can be difficult.
Let's take a closer look at the 5 best heat map software, examining their features, benefits, and downsides to help you make an informed decision about which one is best for you.
1. Matomo Analytics
Matomo is the most popular open-source online analytics platform, with over 1.4 million websites in over 190 countries and over 50 languages translated. Matomo prioritizes data privacy, data ownership, and no data sampling.
The platform offers two hosting options: cloud and on-premise. The cloud eliminates the need for installation, whereas On-Premise is free, open-source, and self-hosted PHP/MySQL software that you can install on your server, giving you maximum flexibility.
With features like heatmaps, session recordings, goals, form analytics, visitor profiles, e-commerce, and funnels, this premium web analytics and conversion optimization tool is designed to provide you with the most conclusive information.
Features
- Website analytics
- Cohort analysis
- Funnel analysis
- In-App events tracking
- Retention tracking
Pros
- Insightful user analytics
- Easy implementation
- Dashboard with graphical analytics
- Alternative to Google Analytics
- Open-source platform
Cons
- Poor customer support
- Outdated user interface
- Limited usability
- Bugs affecting accuracy
Pricing
- On-Premise(Self-Hosted): Free Download
- Cloud Business: $19/month
- Cloud Enterprise: Custom Quotation
- Free Trial available
2. QlikView

QlikView is another well-known data visualization software with heat mapping capabilities. Its user-friendly interface allows users to create dynamic dashboards.
QlikView has a number of advanced features, making it a user-friendly and good option for organizations looking to deploy heat mapping tools. However, employing QlikView's more sophisticated capabilities may necessitate technical skills and be costly.
Features
- Performance management
- Performance metrics
- Ad Hoc reports
- Dashboard
- Data analysis
- Profitability analysis
- Trend / Problem indicators
- Data quality management
Pros
- Good UI/UX
- Reports and analytics
- Data visualization
- Data export
- Easy setup
Cons
- Slow drag-and-drop technology
- Difficult real-time data analysis
- Requires large memory space
- Redundant local data generation
- Time-consuming export options search
Pricing
- Free Trial Available
- Custom (Quotation Based)
3. Microsoft Power BI

Powerful data visualization software with heat mapping features, Microsoft Power BI is a great option. It connects with other Microsoft products like SharePoint and Excel and is user-friendly. Nevertheless, Power BI may have a restricted range of customization choices, and using its more sophisticated capabilities may call for technical expertise.
Microsoft Power BI enables you to connect to your data no matter where it resides. Then, using amazing interactive visualizations, you can investigate your data, publish reports and dashboards, engage with your team, and share findings internally and externally.
Features
- Monthly updates
- Insights from big datasets
- Build unique visuals with R and Python
- Analyze data with Excel
- Create beautiful maps
- Easy data transformation with Power Query
- Automated data updates
Pros
- Unlimited drill-down potential
- Explore data easily
- Play around with data
- User-friendly interface
- Easy insight derivation
Cons
- Difficulty in multi-source data merging
- Clunky desktop version
- Program needs cleaning
Pricing
- Power BI Pro: $9.99 Per user/month
- Power BI Premium (User): $20 Per user/month
- Power BI Premium (Capacity): $4995/month
- Free Trial available
4. Google Analytics
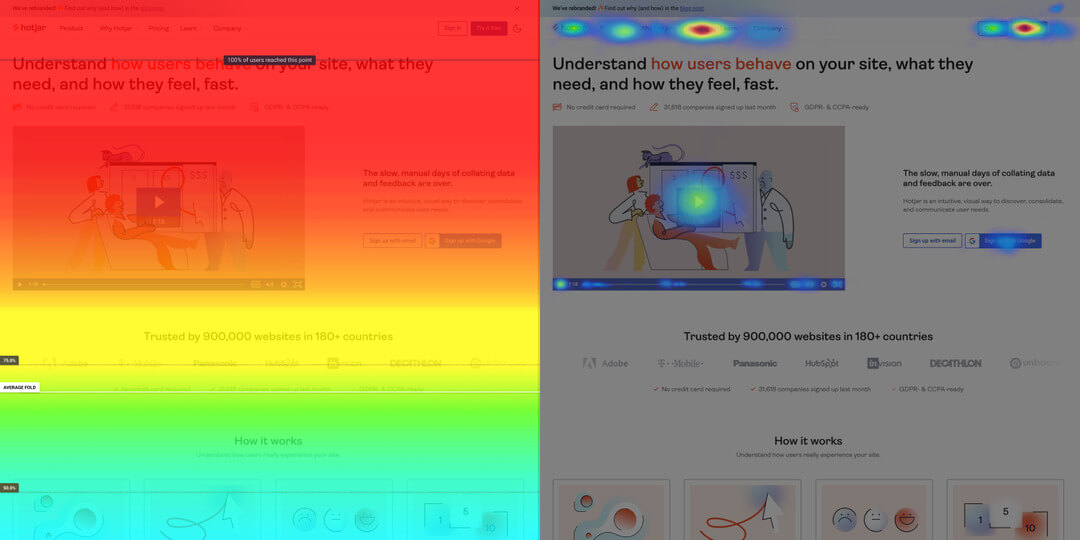
Google Analytics allows you to track web page visitor behavior using heat mapping. It is simple to use and provides useful information about user behavior and involvement. Users can take advantage of Google's unique insights and machine-learning skills to help them make the most of data.
Google Analytics is designed to integrate with Google's advertising and publishing tools, allowing you to use analytics insights to target the right customers. With an easy-to-use interface and shareable reports, you can swiftly process and share your data.
Features
- Campaign management
- Conversion tracking
- Goal tracking
- Keyword tracking
- Multiple site management
- Pageview tracking
- Referral source tracking
- Site search tracking
Pros
- Simple setup and integration
- Large amount of data and reports
- Segment data by dimensions and filters
- Customize data collection and analysis
- Create goals and events
- Create custom reports and dashboards
- Advanced features for optimization
Cons
- Steep learning curve
- Extensive study required
- Overwhelming or confusing at first
- Unfamiliar features
Pricing
-
Free Version available
5. Capturly
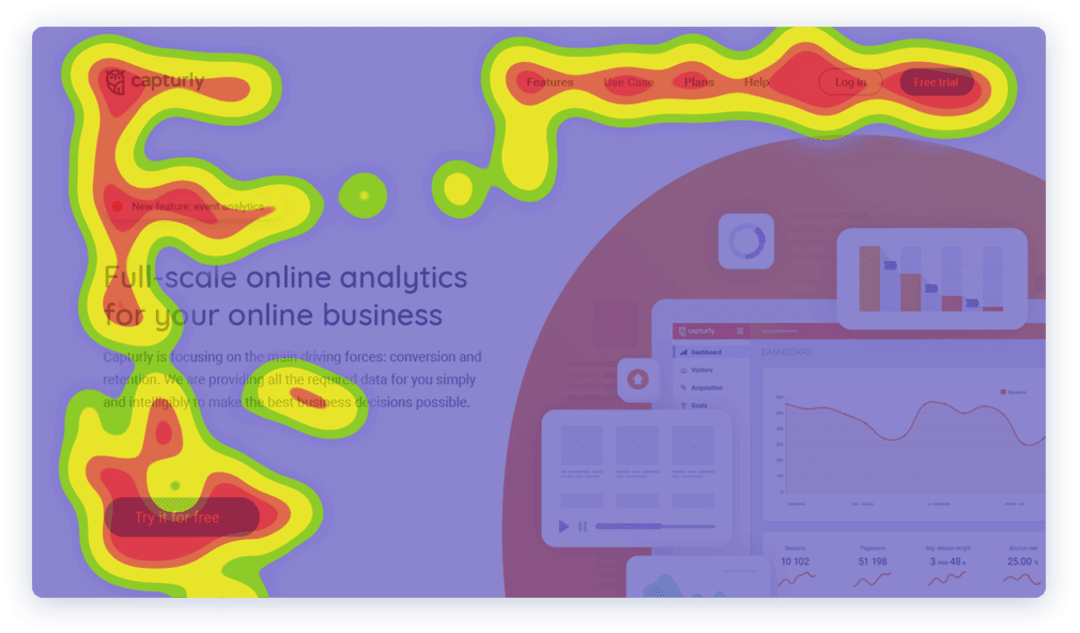
Traditional analytics, session replays, heatmaps, and conversion funnel capabilities are uniquely combined in Capturly. It concentrates on conversion and retention as the key driving elements.
Capturly is a one-of-a-kind combination of traditional website analytics features that allows you to monitor key indicators in real-time and more advanced features. The online analytics tool makes it easier to understand how visitors interact with your website. It enables users to collect all essential data in one place to generate actionable business insights.
Features
- Heatmap tools
- Session replay
- Conversion funnel
- Analytics platform
Pros
- Better segmented heatmaps
- Advanced filtering
- Affordable pricing package
- Scroll heat maps
- Event tracking
Cons
- Lack of browser console recording
- No video testimonials
- Visual live chat can be improved
Pricing
- Lite: $29.00/month
- Growth: $79.00/month
- Plus: $299.00/month
- Free Trial Available
Latest Trends In Heatmap Software Tools
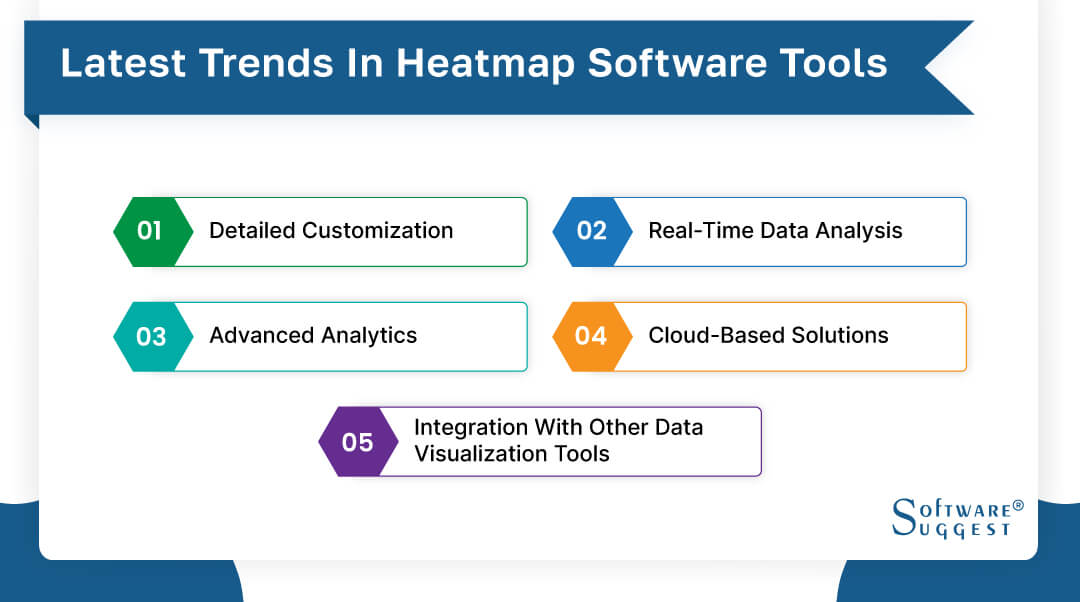
Heatmap software tools have become increasingly popular in recent years due to their ability to represent data in a clear and concise way visually. Here are some of the latest trends in website heatmap software :
-
Integration with other data visualization tools
Heatmap analytics software is being developed to work with other data visualization tools such as dashboards, charts, and graphs. This facilitates data analysis and comprehension for users.
-
Detailed customization
Users can now change the colors, labels, and scales of their heatmaps. This enables them to generate personalized visualizations that are tailored to their specific requirements.
-
Real-time data analysis
Heatmap software is becoming more proficient at dealing with real-time data streams. Users may now monitor their data in real-time and make more informed decisions.
-
Advanced analytics
Advanced analytics features are being added to heatmap software solutions, allowing customers to gain deeper insights from their data. Clustering, anomaly detection, and predictive analytics are among these features.
-
Cloud-based solutions
Many heatmap software applications are now cloud-based, allowing users to view their data and visualizations from anywhere in the world. This also makes it easy for teams to communicate and share their findings.
Pricing Information Of Heatmaps
The cost of heatmap software varies greatly based on the capabilities and functionality required. While some basic tools are free, more powerful software programs might cost hundreds or even thousands of dollars. There are choices with monthly prices as cheap as a few dollars if you want to employ heatmap software to acquire insights into website visitor behavior.
Prices for professional-grade experimentation tools and sophisticated analysis capabilities can run from hundreds to thousands of dollars per month. The cost of heatmap software will ultimately be determined by the features and capabilities that you demand.
Conclusion
In conclusion, the heatmap software tool, which has several alternatives on the market, is a crucial tool for data visualization and analysis.
Real-time analytics, machine learning, mobile compatibility, customization, interaction with other software, and teamwork are the newest developments in heatmap software.
You should also consider the program's features and the degree of support offered.
You may acquire important insights and make better decisions based on data analysis by carefully choosing the best heatmaps for funnel analysis for your needs.
FAQs
You can get quick insights into:
- If your website navigation is working;
- Identify the element that is distracting your user from the core content;
- Which image is attracting your customers more (Can be useful in adding links to it)
- If the long-form content is working or not.
A. Heatmaps provide a colored overlay on your website. Generally, the red spots in the map are the most popular or considered as the ‘hot spots.’ And, the areas that are void of colors are the least popular spots.


